Strong Momentum, Strong Trend: Reading RSI at New Highs

The S&P 500 ($SPX) continues to move onward and ever upward, with investor optimism reflected in the strong price action and meaningful momentum support. The Relative Strength Index (RSI) for the S&P 500 has been hovering around the 70 level for the last three weeks, indicating strong momentum as the major U.S. equity benchmark pushes above 7200 for the first time in history.
So are these overbought conditions good news or bad news for stocks? Today, I will dig into RSI’s benefits as a momentum indicator, review recent examples of overbought conditions and bearish divergences, and reflect on potential next steps for the S&P 500.
Overbought Means Up a Lot
It’s important to remember that an overbought condition, which often seems like a bearish contrarian signal on the surface, can serve to confirm a long-term uptrend phase. The chart of Broadcom (AVGO) provides examples of how strong momentum often leads to further gains.
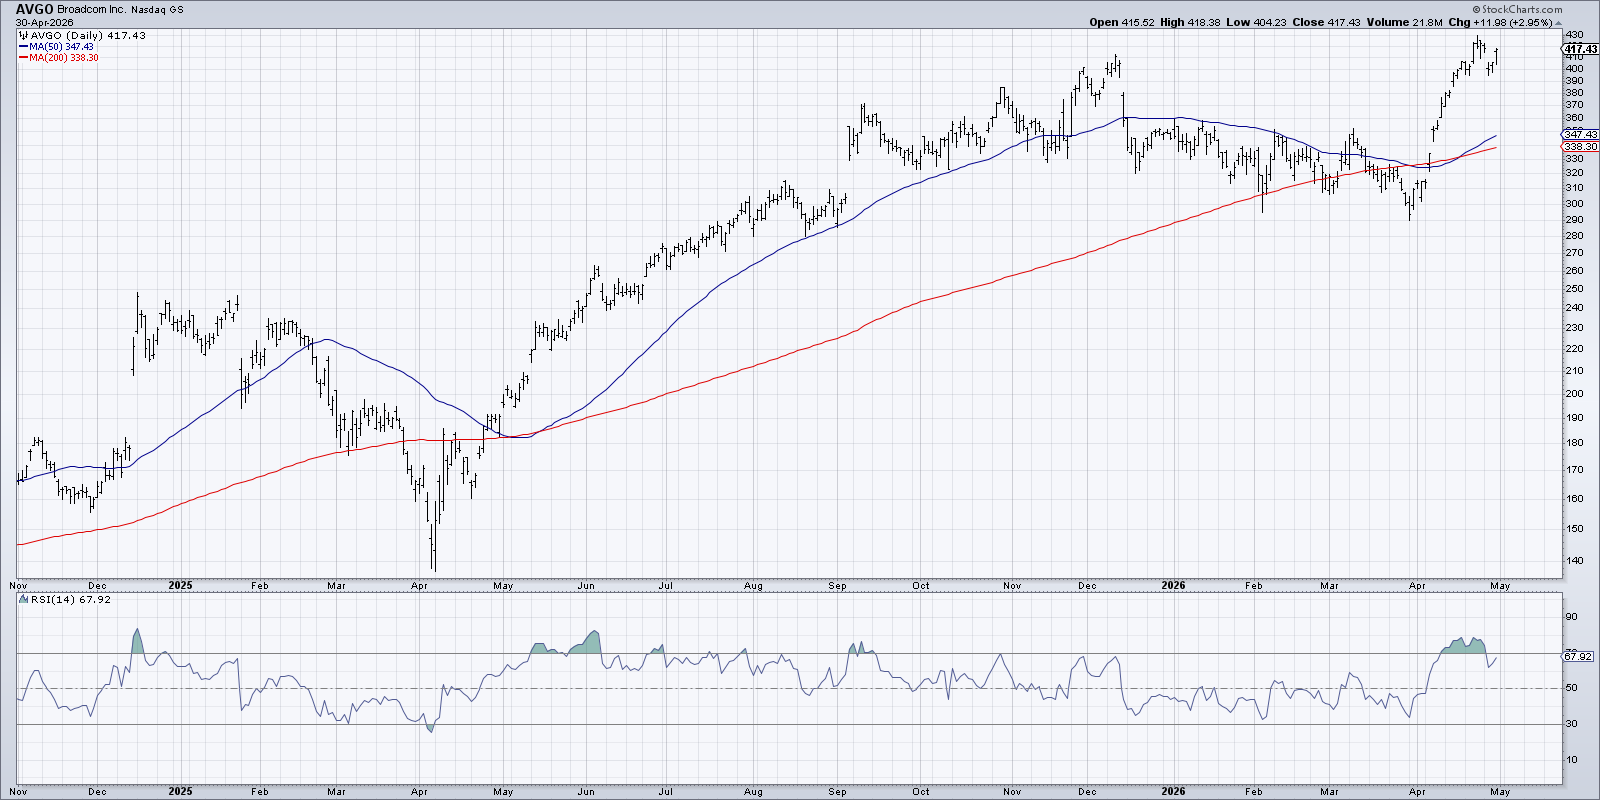
Look back to May 2025 for an example of strong momentum on a breakout move, when AVGO gapped above $210. The RSI overbought conditions during the breakout demonstrated the strong upside momentum behind the uptrend, which continued higher until the eventual peak in December around $410.
The RSI became overbought numerous times during that accumulation phase, with pullbacks seeing the RSI remain mostly above 50. Those higher lows on decent momentum can also help validate a long-term uptrend, all combining to paint a bullish picture for Broadcom into year-end 2025.
Bearish Divergences Signal Weaker Momentum
Higher highs on stronger momentum are bullish, but higher price highs marked by weaker momentum readings can signal a lack of potential follow-through. The chart of Ford Motor Co. (F) features a clear bearish momentum divergence going into the February 2026 peak.
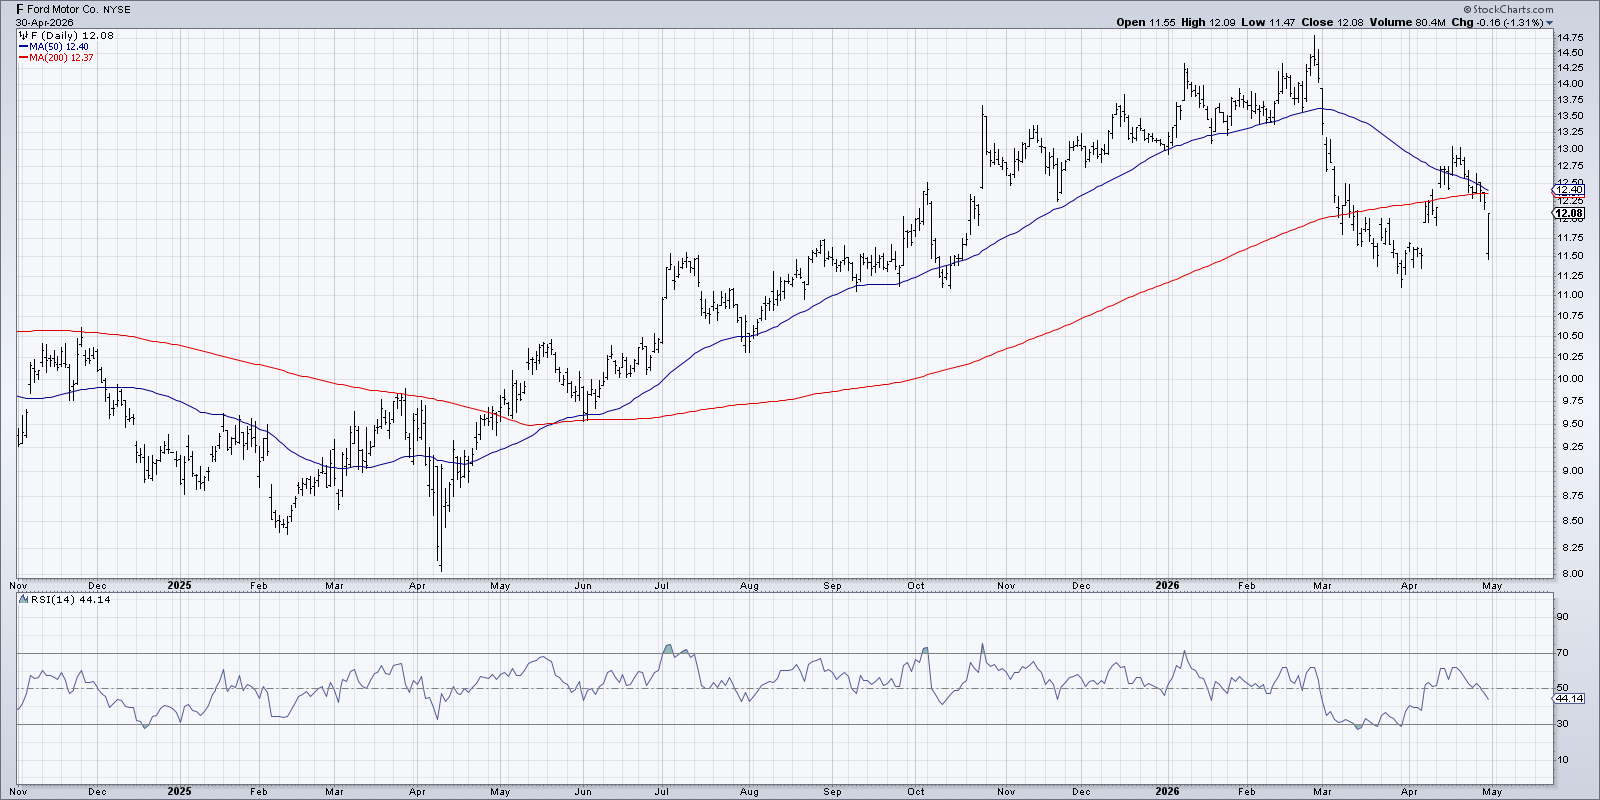
There were several smaller bearish momentum divergences during the 2025 uptrend, where the price achieves higher highs but the RSI slopes downward. You may notice that the RSI never got below the 40 level on the subsequent pullbacks, suggesting that dip buyers were coming in and allowed the uptrend to continue despite the momentum divergences.
The 50-day simple moving average also served as key support during the 2025 bull market phase, with pullbacks for Ford often ending right at the 50-day. How did the 2025 uptrend phase end? We finally saw a bearish momentum divergence that resulted in the RSI moving below 40, which the price broke right through the 50-day moving average.
Strong Moves Supported By Strong Momentum
With those two chart examples in mind, let’s head back to the chart of the S&P 500 to assess the market phase in terms of trend and momentum. The recent overbought conditions appears to confirm a bullish trend phase, as we discussed with the chart of AVGO.
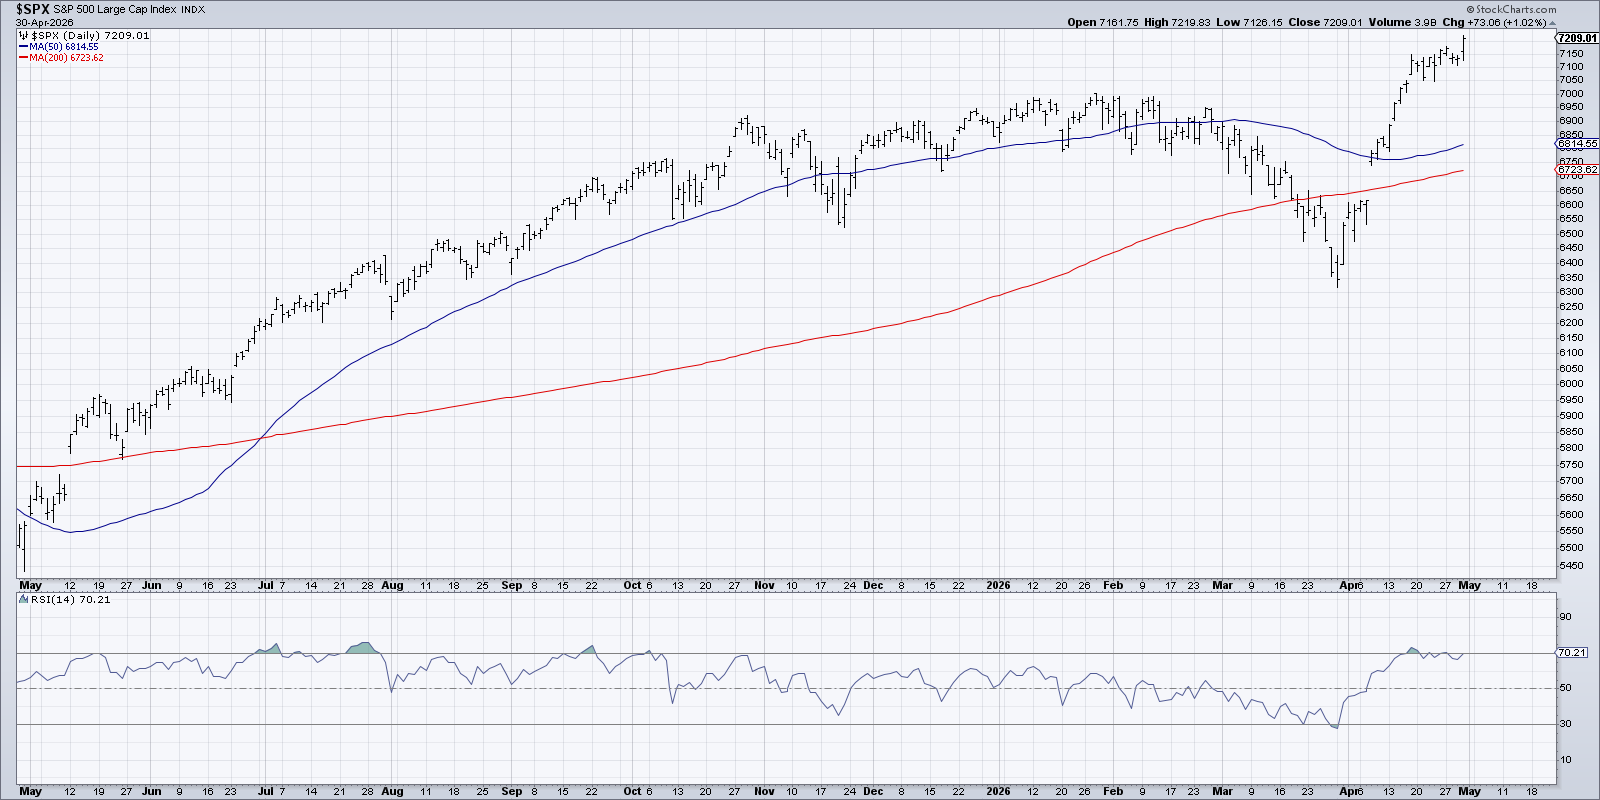
I’m not detecting any bearish momentum divergences, which could indicate weakening support for the current uptrend phase. With the index pushing to new all-time highs, and the momentum readings appearing quite constructive, we’re inclined to see this as an “innocent until proven guilty” kind of uptrend phase.
What would tell us that the current bullish phase is no longer in place? Besides macro indicators like the VIX and credit spreads, we’re inclined to lean into the simple measures of trend and momentum discussed today.
As long as the S&P 500 keeps making higher highs and higher lows, we’re still in a primary uptrend. As long as the RSI pushes into overbought territory on breakouts, and remains above 40 on pullbacks, we’re still in a primary uptrend. And as long as there are no bearish momentum divergences for the S&P 500, we’re still in a primary uptrend.
Investing doesn't have to be too complicated. And by following some simple trend-following rules and methods, we can participate in the uptrend phase as long as the chart tells us it's still firmly in place!
RR#6,
Dave
P.S. Ready to upgrade your investment process? Check out my free behavioral investing course!
David Keller, CMT
President and Chief Strategist
Sierra Alpha Research LLC
marketmisbehavior.com
https://www.youtube.com/c/MarketMisbehavior
Disclaimer: This blog is for educational purposes only and should not be construed as financial advice. The ideas and strategies should never be used without first assessing your own personal and financial situation, or without consulting a financial professional.
The author does not have a position in mentioned securities at the time of publication. Any opinions expressed herein are solely those of the author and do not in any way represent the views or opinions of any other person or entity.