StockCharts Insider: Three Ratios Every Crypto Trader Should Chart
Before We Dive In…
Scroll across any feed on social media and you’ll find crypto charts dominating almost every trading-related topic. There’s a lot of hype and noise in the crypto content sphere. Taken together, however, none of the posts can clearly show where money is going. In the equities world, investors have ways to gauge rotations—risk-on vs. risk-off, cyclical vs. defensive, growth vs. value, etc. The same tools can be used to assess crypto rotations, helping you see where money is flowing and what phase of the risk cycle crypto is currently in.
The Crypto Risk Ladder
The crypto world generally has four phases in its risk cycle. Each phase of the cycle marks an uptick in risk sentiment:
- Phase I - Bitcoin: Fiat and stablecoins flow into Bitcoin
- Phase II - Ethereum: Capital begins flowing into ETH
- Phase III - Large-Cap Alts: Money spreads to major altcoins
- Phase IV - Memecoins and Micro-Caps: Money moves into highly speculative coins
Now the caveat. This cycle looks like a clean sequence, but is anything but. It illustrates tendencies from a history that’s relatively short. Rotation doesn’t shift cleanly from one phase to the next; phases can also bleed into one another. So, take this as a proposition, not a fixed sequence.
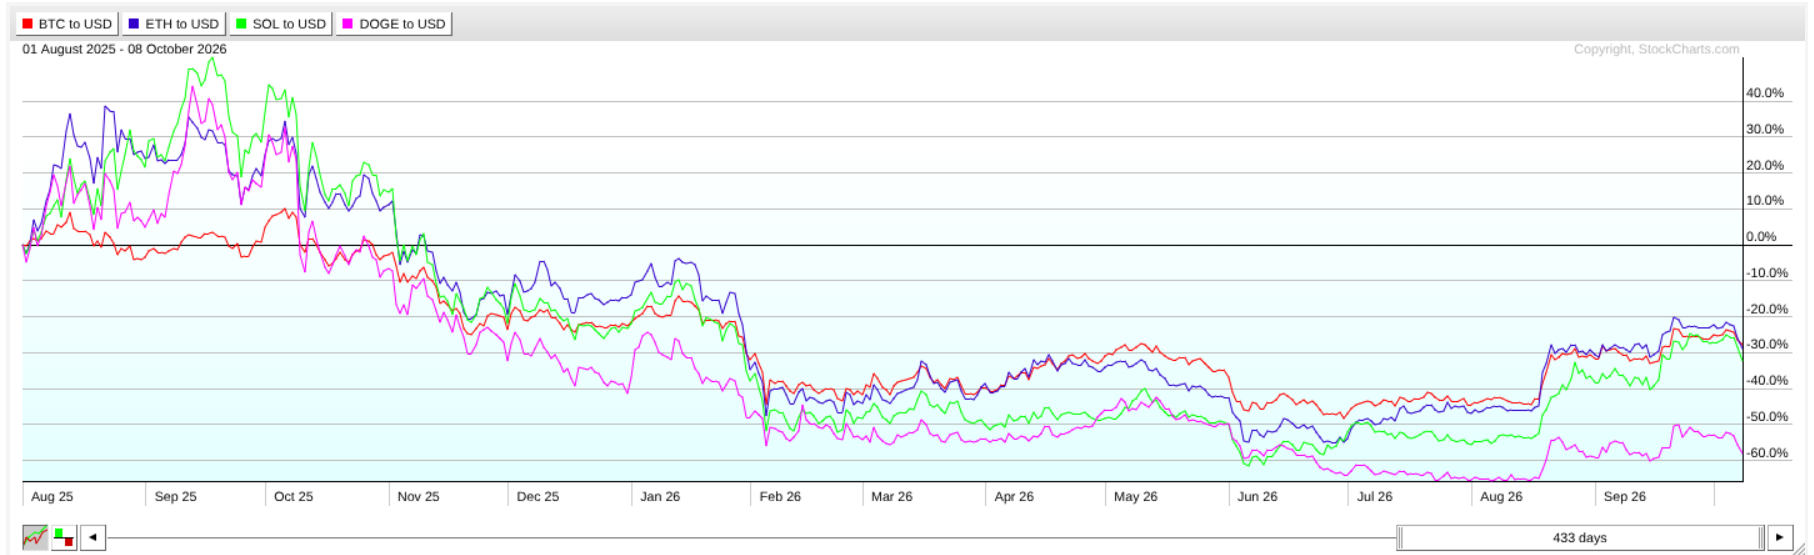
Note the variance in performance and capital flows over time. Check out the speculative stretch from late 2024 into early 2025, when Solana and Dogecoin were outperforming Ethereum and Bitcoin, and follow how it worked its way to the current sequence.
To follow these movements, we’ll focus on three ratios:
- Ethereum/Bitcoin ($ETHUSD:$BTCUSD)
- Solana/Ethereum ($SOLUSD:$ETHUSD)
- Dogecoin/Bitcoin ($DOGEUSD:$BTCUSD)
I’ll explain what each ratio implies and how to read them.
ETH/BTC Ratio Explained
The ETH/BTC ratio measures the performance of Ethereum against Bitcoin by dividing the price of ETH (in USD) by the price of BTC (in USD). This cancels out the fiat price, making it a pure crypto metric. It also tells you how much BTC one ETH can buy.
- When the ETH/BTC ratio rises, it indicates that sentiment is leaning favorably toward Ethereum’s utility functions: smart contracts, DeFi, stablecoins, and other applications built on its network. Some would consider this “risk-on,” though people will have varying opinions about this, depending on how much they trust BTC as a store of value.
- When the ETH/BTC ratio falls, Bitcoin is outperforming Ethereum. This indicates that the market may be prioritizing store of value over utility. Institutional money is favoring Bitcoin. It can also mean economic jitters. Ethereum may be losing fee revenue to cheaper Layer 2 networks.
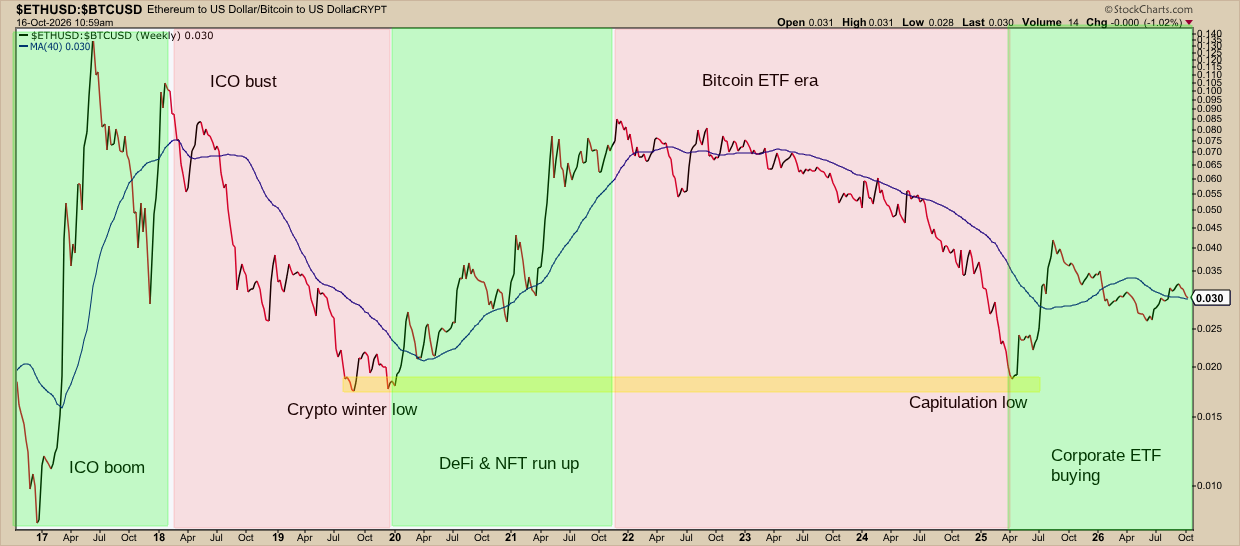
Without diving into this too deeply, you’re basically looking at Ethereum’s ICO boom and bust, the 2019 crypto winter low, the DeFi and NFT boom, the dawn of the Bitcoin ETF era, the 2025 capitulation low, and the institutional ETH accumulation that followed. The ratio then began hovering around 0.030, right on its 40-week simple moving average.
SOL/ETH ratio explained
If the ETH/BTC ratio does a semi-decent job tracking the shift from Phase I to Phase II, then the SOL/ETH ratio might indicate a shift from Phase II to Phase III. Solana is among Ethereum’s biggest smart-contract rivals, and it’s also a coin that attracts lots of speculative trading, making it a reasonable proxy for large-cap altcoin demand.
- When the SOL/ETH ratio rises, it suggests that sentiment is heading further out on the risk curve—an early sign that altseason may be arriving.
- When the SOL/ETH ratio falls, money is moving back toward the relative safety of Ethereum’s liquidity and institutional ecosystem.
If you look at each chart on its own, it’s sometimes hard to tell them apart. They move in the same direction. And that’s the value of this ratio—it highlights the difference between the two. You can see more clearly who’s leading and lagging.
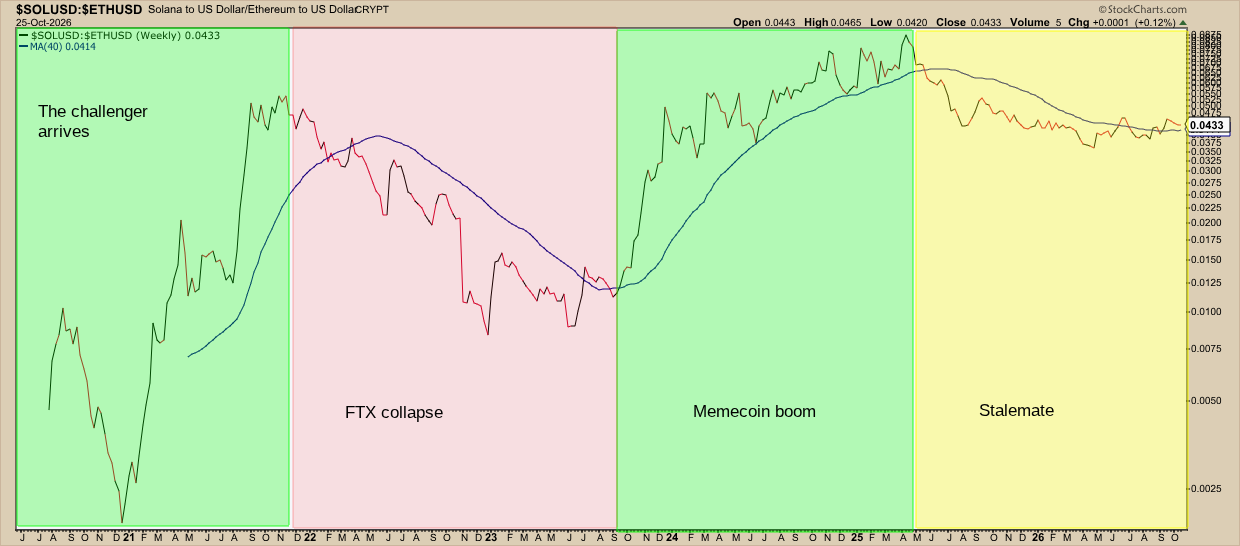
You can see Solana’s rise from late 2020 through 2021. A new contender, Solana’s high speed and low fees attracted many developers, NFT projects, and crypto traders. But in 2022, the collapse of FTX, one of Solana’s biggest backers, hit the coin hard. Solana recovered in 2023 and became a foundational layer of the 2024 memecoin boom. Speculative money skipped the Ethereum rung of the risk ladder and went straight to Solana, an altcoin. Once the memecoin mania cooled, institutional money flowed into ETH and the SOL/ETH ratio began moving sideways.
Insider Tip #1: Watch SOL/ETH alongside ETH/BTC.
When both rise together, it suggests that money is moving into the latter part of the risk ladder.
DOGE/BTC ratio explained
DOGE/BTC tells you when money is hitting the top of the ladder—pure mass speculation. That’s because Dogecoin doesn’t have much utility, unlike other altcoins. It’s a meme.
- When the DOGE/BTC ratio rises, retail speculation is heating up.
- When the DOGE/BTC ratio falls, the meme crowd is losing ground to Bitcoin.
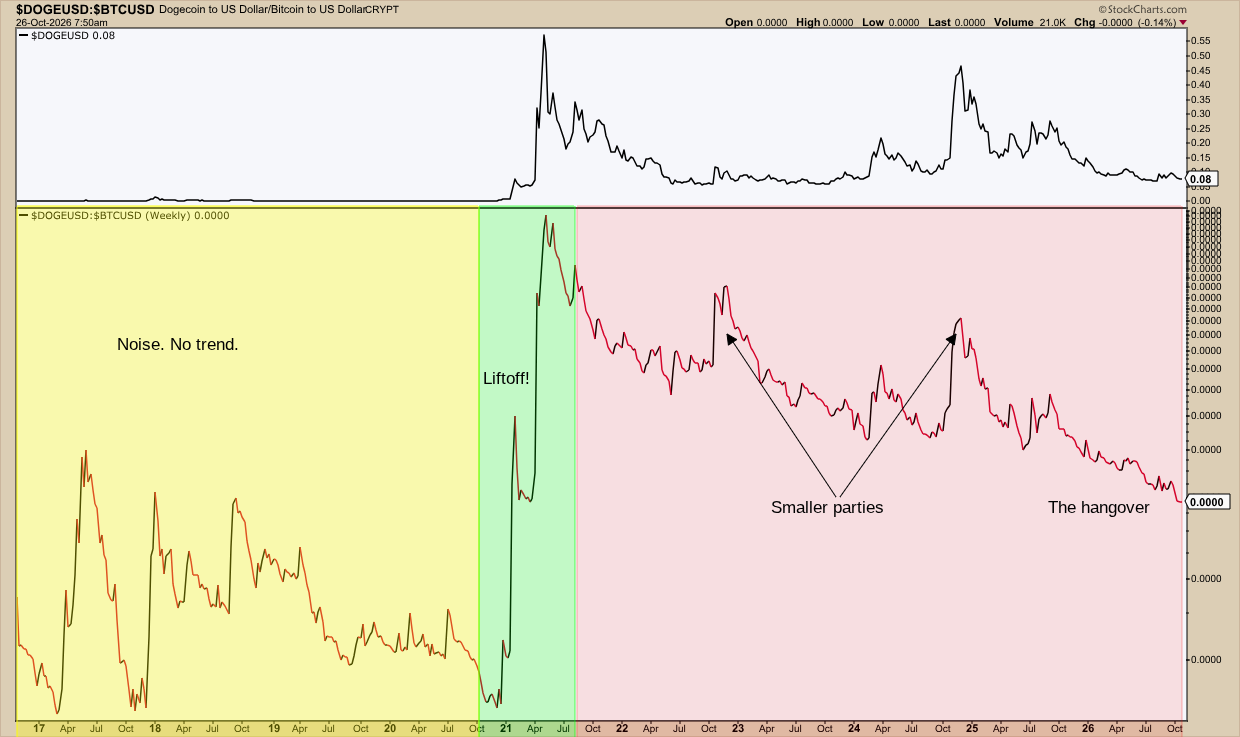
A thing about this chart. The ratio values are so small (about 0.000001) that the axis labels round to zero. That means it's better to focus on the shape than the numbers.
From 2017 to 2020, there’s a lot of volatility and speculation, but no real sustainable story. Lots of excitement though, it seems. Overall, however, it’s market noise. In 2021, in the GameStop memestock era, Elon Musk pumped up Dogecoin in a tweet. The coin took off into the stratosphere. 2022 saw a Twitter-buyout pop. 2024 saw a post-election spike. Each topped out lower than the last. The ratio has been in hangover mode after that last spike. I plotted a chart of $DOGEUSD above the main chart so you can see more clearly what was going on with the memecoin.
Reading the Ladder Together
When all three ratios are rising, you’re seeing an aggressive crypto rally backed by strong breadth. Money is climbing every rung of the ladder. When ETH/BTC falls while SOL/ETH and DOGE/BTC rise, money is likely flooding into Bitcoin, Solana, and smaller speculative plays.
This describes a strange, almost lopsided market of sorts. Longer-term holders are piling into Bitcoin while speculators are piling into Solana and memecoins.
Keep in mind that coin-specific events can move ratios regardless of the broader rotation context. In Solana’s case, it was the FTX collapse; for Dogecoin, it was the Musk tweet.
Insider Tip #2: A “depressed” ratio isn’t a bargain.
When a ratio hovers near multi-year lows, it’s tempting to think it’s coiled, and that a snapback may be imminent. The same thing can be said about a “compressed” ratio going sideways. Be careful with this, however; crypto ratios can stay in this state for years. Wait for the ratio to turn first, and then figure out the catalyst driving the move.
And That’s a Wrap
You don’t need to be a crypto enthusiast to follow what’s going on in the broader crypto market. These ratios tell the general story. Save them to a ChartList and check them every now and then. When they rise in sequence—ETH/BTC, then SOL/ETH, then DOGE/BTC—money is moving up the ladder. When only the top rungs rise, the rally is lopsided. When all three ratios are rising, the crypto rally is broad. Either way, you’ll see the rotation take place on the charts before you hear about it on your social media feed.
Disclaimer: This article is for educational purposes only and is not investment advice. Examples are for illustration, not recommendations. Do your own research or consult a financial professional before investing.