Tailor Your Charts to the Trend, Not the Headlines
We had a smorgasbord of market-moving events this week, including inflation data, renewed U.S.-Iran tensions, SpaceX IPO, and the kickoff of the FIFA World Cup 2026TM.
When the stock market turns volatile, especially on news-driven moves, it’s often accompanied by a “surround sound” of opinions from every corner. And when you get an influx of opinions from talking heads, headlines, and social media threads, making sense of the market can feel as confusing as trying to understand the offside rule in soccer.
All this noise doesn’t help your anxiety level. It rises, you panic, and you make hasty, and often poor, investment decisions.
So how can you avoid falling into this trap? By shifting your attention from the day-to-day noise to the longer-term “big picture.”
When I’m trying to make sense of this type of market, I often go back to John Murphy’s first law of technical trading. The law emphasizes the importance of starting your analysis with monthly or weekly charts. Because of this, I’ve set up my StockCharts StyleButtons to quickly pull up a 20-year monthly chart and a five-year weekly chart.
If you haven’t set up your StyleButtons, I highly recommend doing so. Think of how useful it is to view any chart instantly with your overlays and indicators already in place. It can shave a lot of time off of creating charts, allowing you to focus more on your analysis.
Here’s a quick overview of how to set up StyleButtons in SharpCharts so you can view the long-, intermediate-, and short-term charts.
Below the chart, under the Settings tab, click the ChartStyle Library, where you’ll see tons of ChartStyles. Use the Select Library dropdown to explore the different choices. You can save and assign StyleButtons to any of these ChartStyles, but a more effective approach is to create your own ChartStyle using indicators and overlays you rely on most. Once you’ve created your own preferred ChartStyle, you can then add a StyleButton to it for easy access.
The chart below is the 20-year monthly chart I use to analyze the long-term trend.
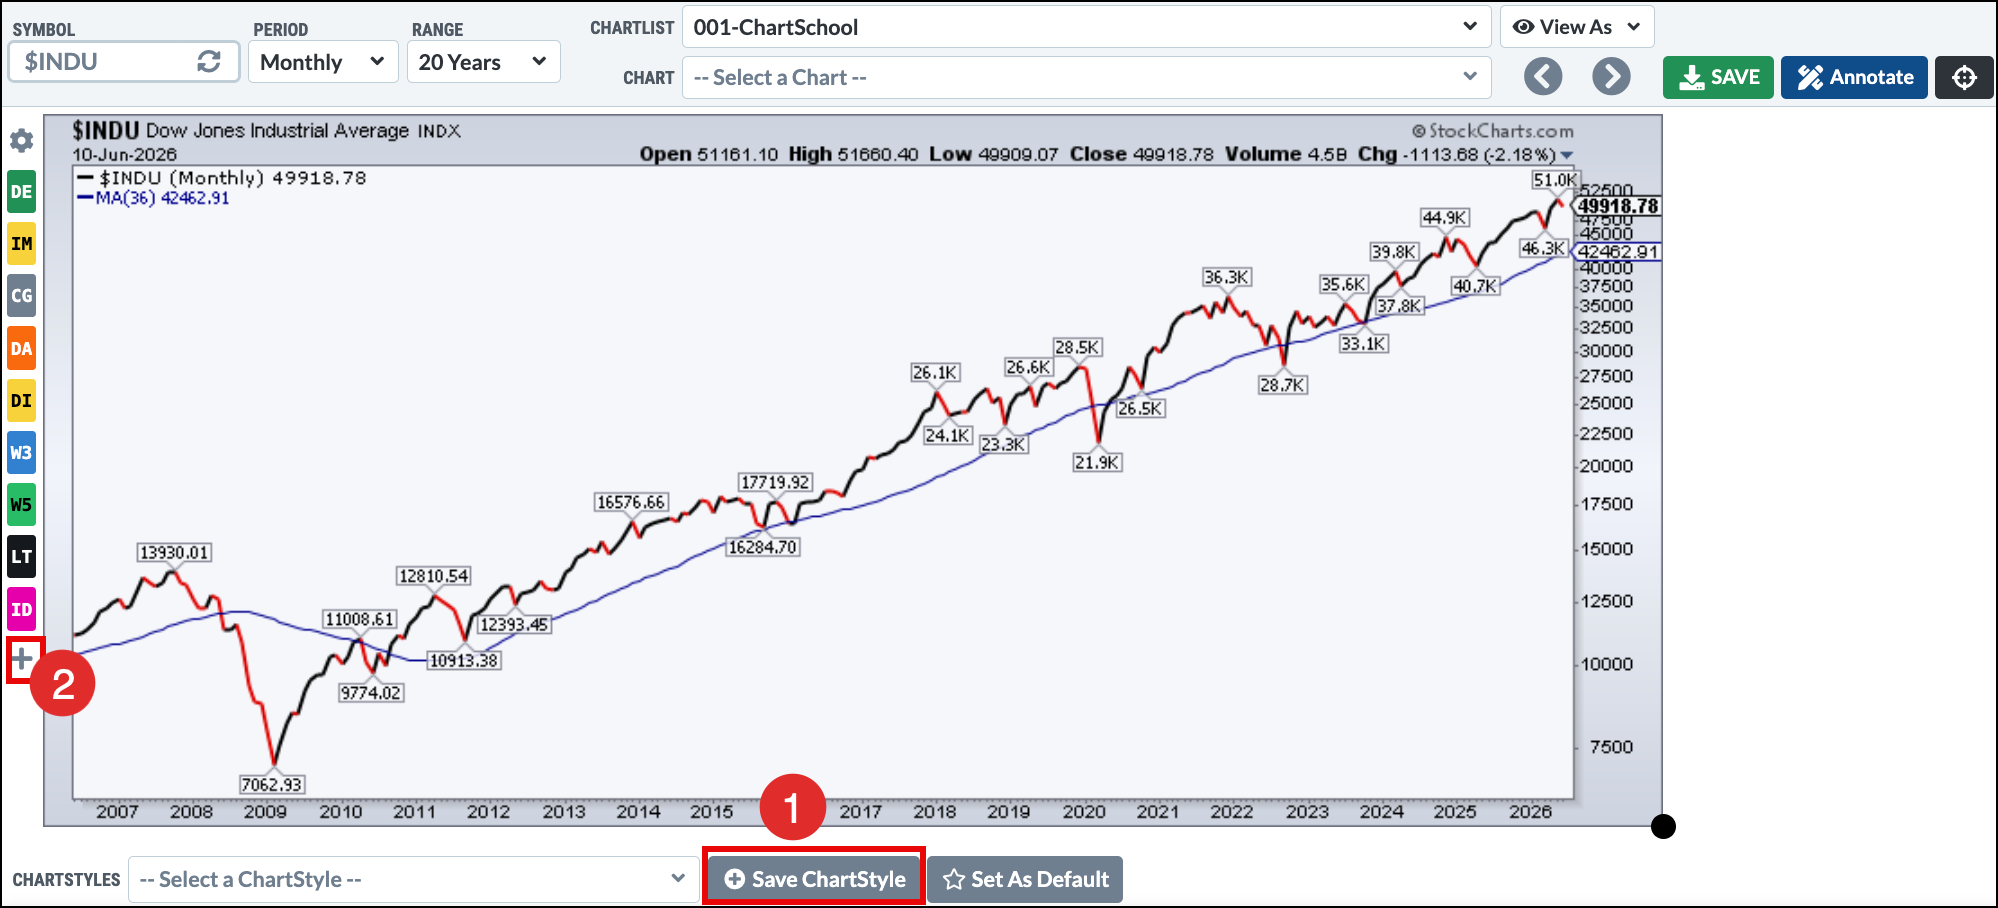
When you create a chart with your preferred overlays and indicators, be sure to follow these steps:
- Click the Save ChartStyle button below the chart.
- Click the + icon, then select the position, label, and color for your StyleButton. Select the ChartStyle you want to assign to the StyleButton.
Run through the same steps for different timeframes. You’ll now be able to quickly view the monthly, weekly, daily, and intraday charts for any ticker symbol.
To summarize, instead of getting pulled into the news cycle, focus on the price action. Setting up your StyleButtons will save you a ton of time, stress, and overthinking. All the information you need to know is right there in the chart in front of you, giving you a clearer and calmer way to manage your money.
Have a great weekend!