The Best Five Sectors This Week #85

Key Takeaways
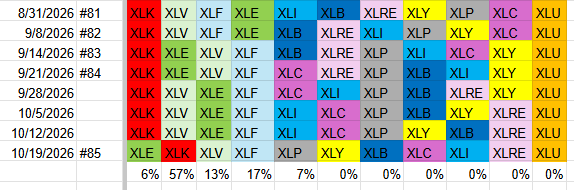
- Technology loses #1 position after 20 weeks.
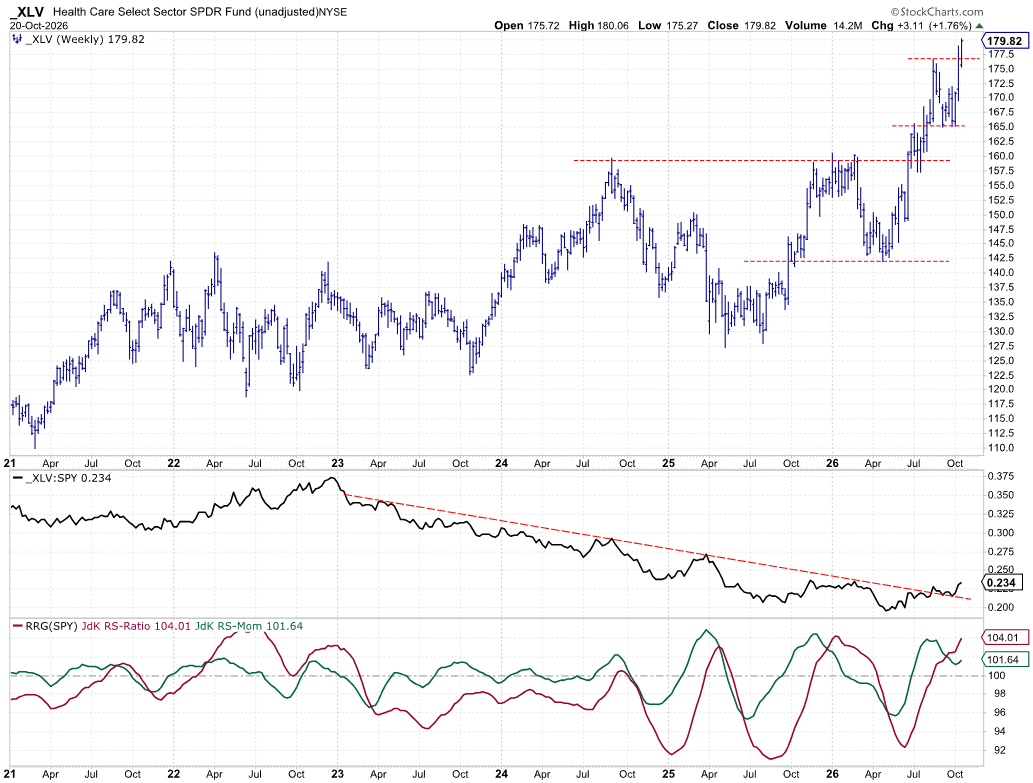
- Energy and Health Care are taking over.
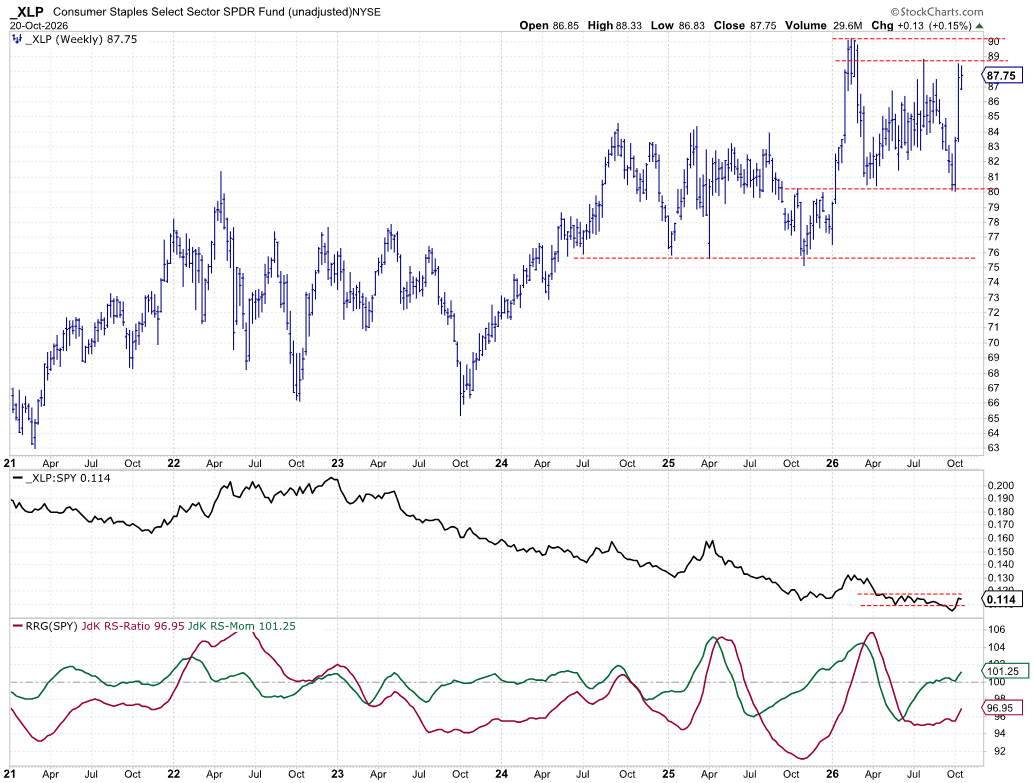
- Consumer Staples enters top-5 while Industrials drop to #9.
Reflecting on the “Best Five Sectors” Series: A Shift in Approach
This update is long overdue. Four weeks behind, to be exact.
I apologize for the delay. While I could blame travel and other commitments, the truth is I should have addressed this much sooner. However, this hiatus gave me the opportunity to reflect on the “Best Five Sectors This Week” series and its value.
Why I Started This Series
At the beginning of 2025, I launched this series after researching daily and weekly RRG (Relative Rotation Graph) values. Through backtesting, I found that ranking the 11 S&P 500 sectors and investing in the top five could give investors an edge. I documented this process to avoid letting valuable research gather dust on a shelf.
Key Lessons Learned
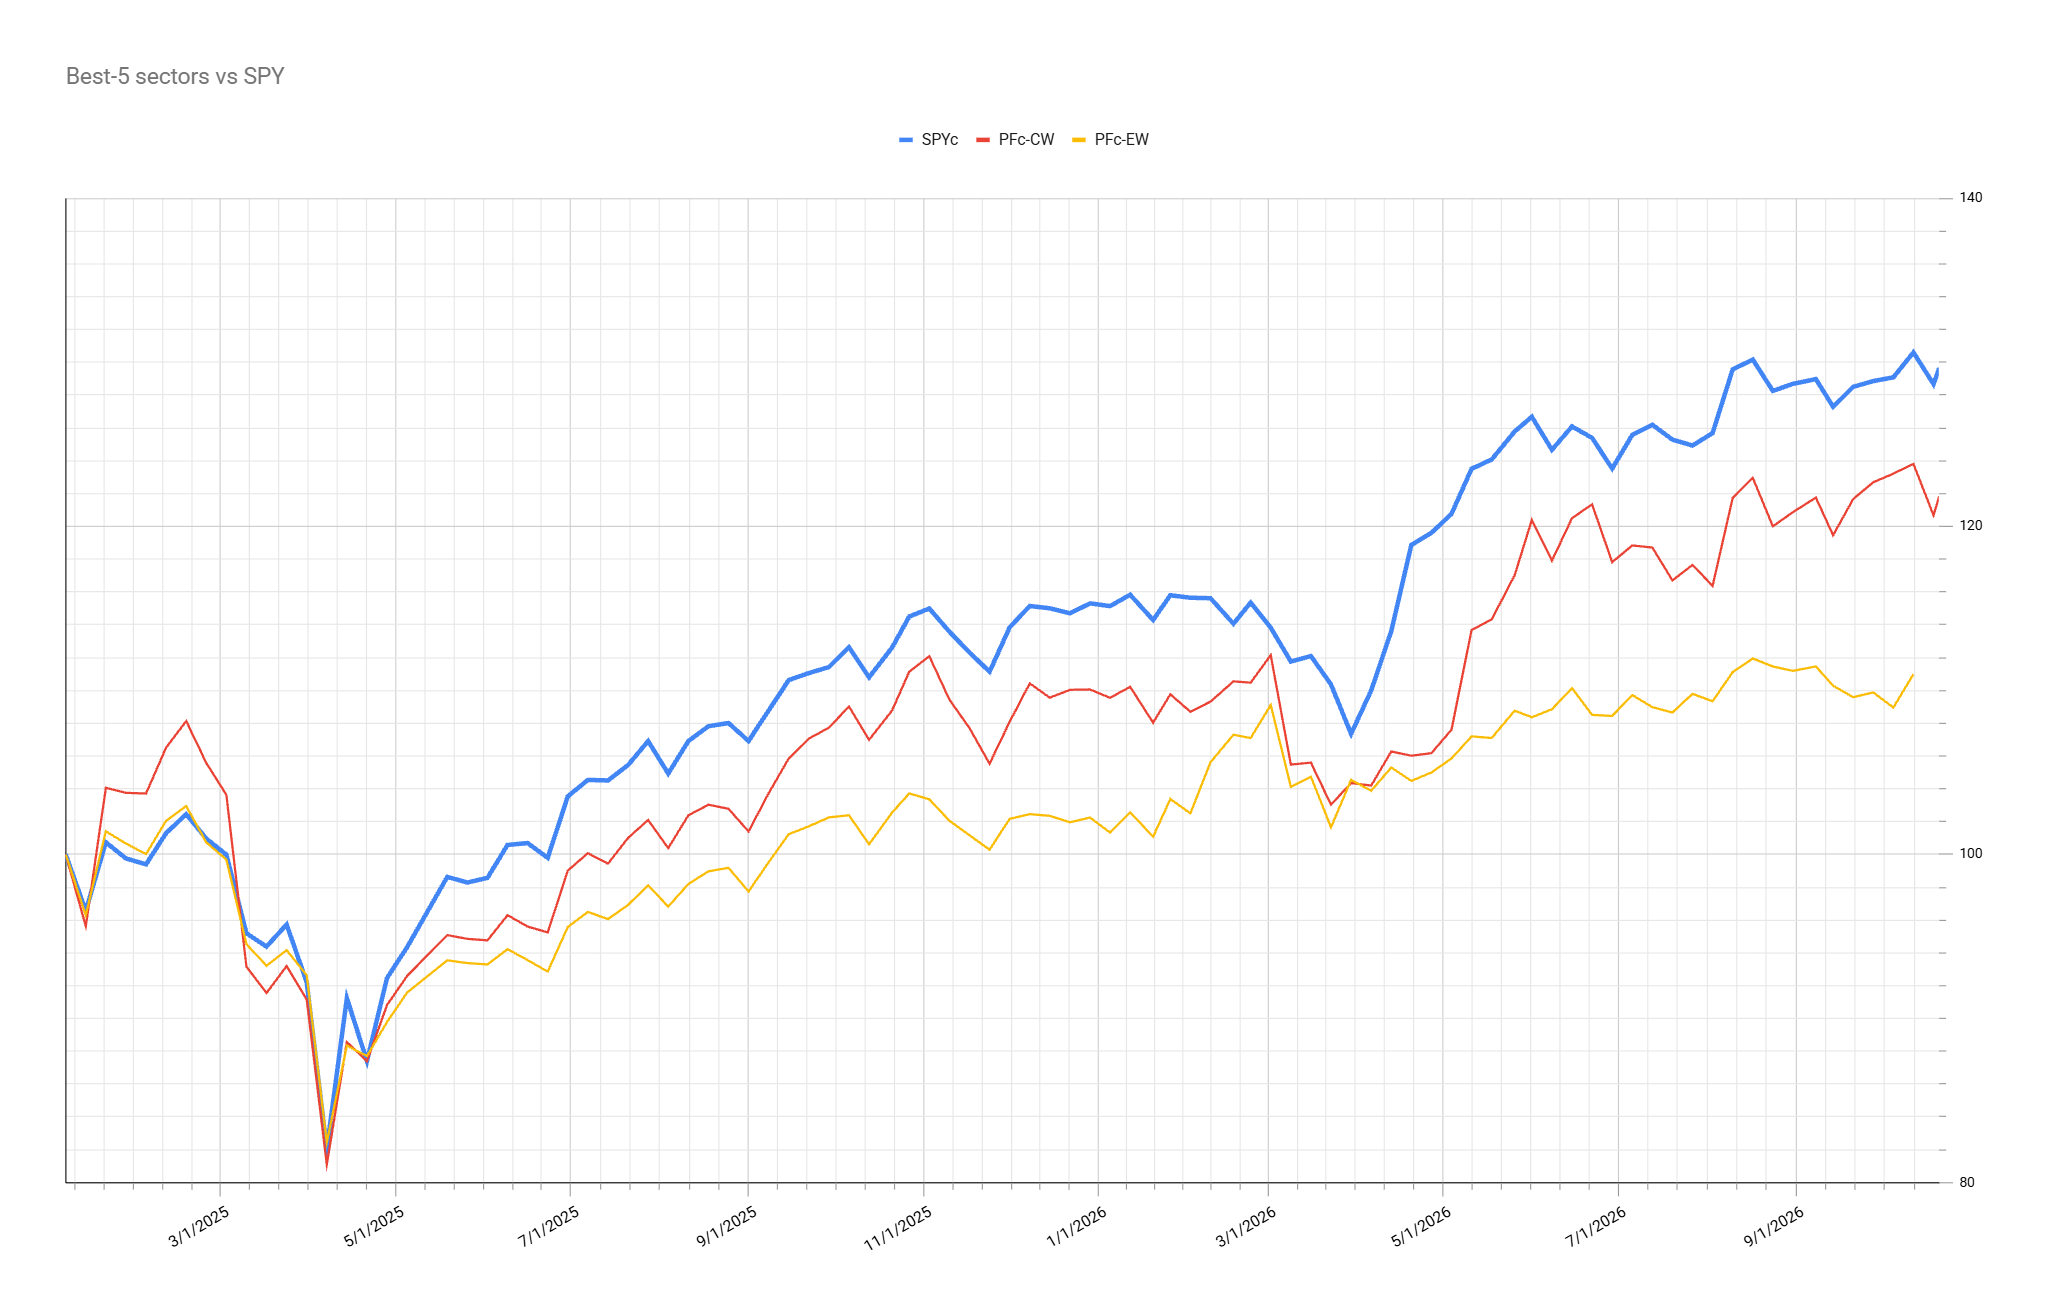
Throughout this experiment, one crucial insight emerged: sector weighting significantly impacts performance. For example, the Technology sector represents about 35% of the S&P 500’s total market capitalization. If you use an equal-weight approach and allocate 20% to each of the top five sectors, you end up 15% underweight in Technology relative to the benchmark. When Technology drives much of the S&P 500’s performance, this portfolio naturally lags, which is exactly what happened.
To address this, I introduced a cap-weighted approach, weighting each sector by its market capitalization. This adjustment improved performance by reducing the lag behind the S&P 500 compared with the equal-weight method. Still, the portfolio currently trails the S&P 500 by about 8%. While there have been periods of recovery, the gap remains. And that’s not the goal of this strategy.
Rethinking the Blog Format
This approach is largely mechanical: it calculates the best five sectors using daily and weekly data, presents the results in a table, and includes charts for each sector. While I’ve been adding brief commentary, I believe most readers can interpret these charts themselves. By streamlining this process, I can focus more on writing about RRG in general, exploring different market universes, approaches, and even individual stocks.
What’s Next
Going forward, I will keep updating the best five sectors approach, as I’m still interested to see if it can eventually catch up with the S&P 500. However, I won’t be adding extensive written commentary to these updates. Instead, I’ll provide the rankings, weights, five sector charts, and a few key takeaways, mainly to document the journey and keep you informed.
Starting this week, I’ll also resume writing more general articles on the RRG approach, discussing how investors can use it for analysis and portfolio construction.
Your Feedback Matters
I welcome your thoughts on this new direction, along with any ideas or requests for future RRG articles. Let me know what you’d like to see covered as we continue this journey together.
9/28/2026
- (1) Technology - XLK [53%]
- (3) Health Care - XLV [12%]*
- (2) Energy - XLE [6%]*
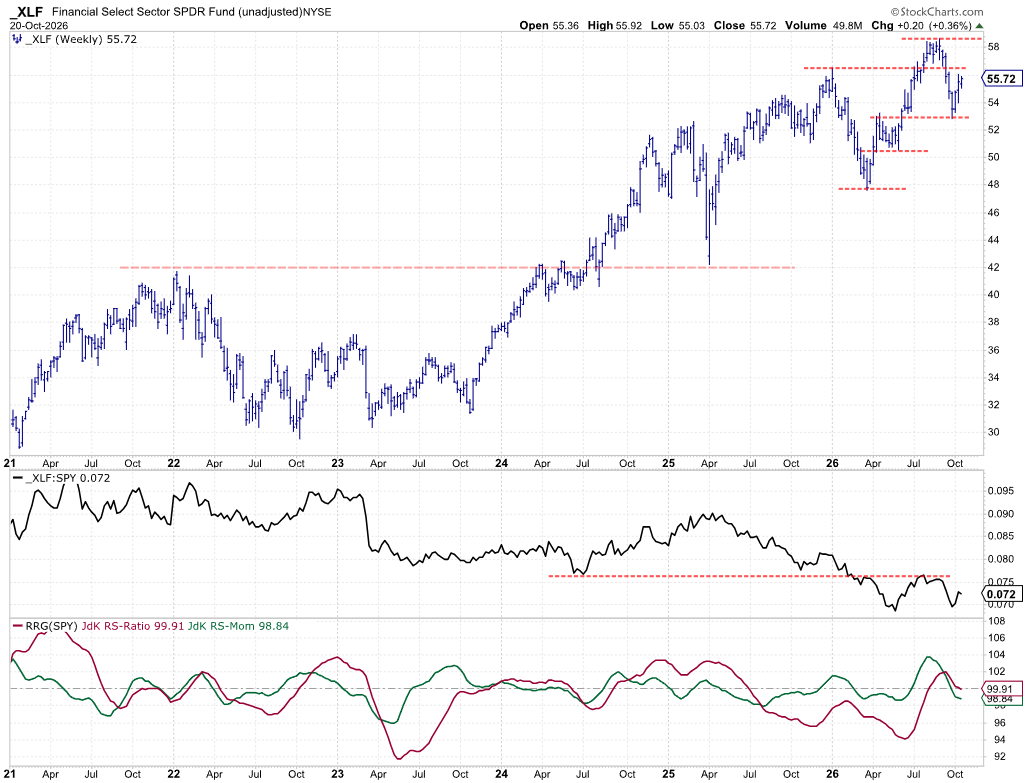
- (4) Financials - XLF [16%]
- (5) Communication Services - XLC [13%]
- (9) Industrials - XLI*
- (7) Consumer Staples - XLP
- (8) Materials - XLB
- (6) Real Estate - XLRE*
- (10) Consumer Discretionary - XLY
- (11) Utilities - XLU
10/5/2026
- (1) Technology - XLK [54%]
- (2) Health Care - XLV [13%]
- (3) Energy - XLE [6%]
- (4) Financials - XLF [17%]
- (6) Industrials - XLI [11%]
- (5) Communication Services - XLC
- (7) Consumer Staples - XLP
- (8) Materials - XLB
- (10) Consumer Discretionary - XLY
- (9) Real Estate - XLRE
- (11) Utilities - XLU
10/12/2026
- (1) Technology - XLK [54%]
- (2) Health Care - XLV [13%]
- (3) Energy - XLE [6%]
- (4) Financials - XLF [17%]
- (5) Industrials - XLI [11%]
- (6) Communication Services - XLC
- (7) Consumer Staples - XLP*
- (9) Consumer Discretionary - XLY*
- (8) Materials - XLB
- (10) Real Estate - XLRE
- (11) Utilities - XLU
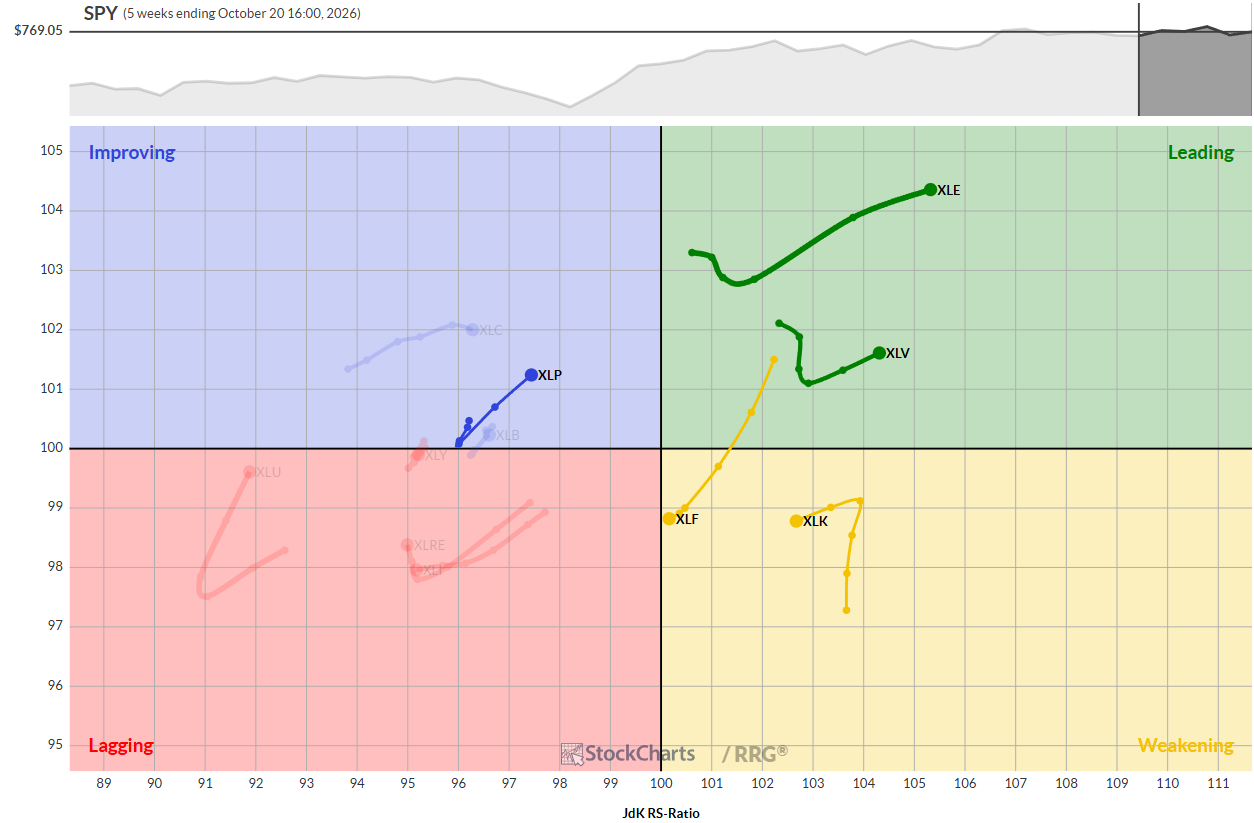
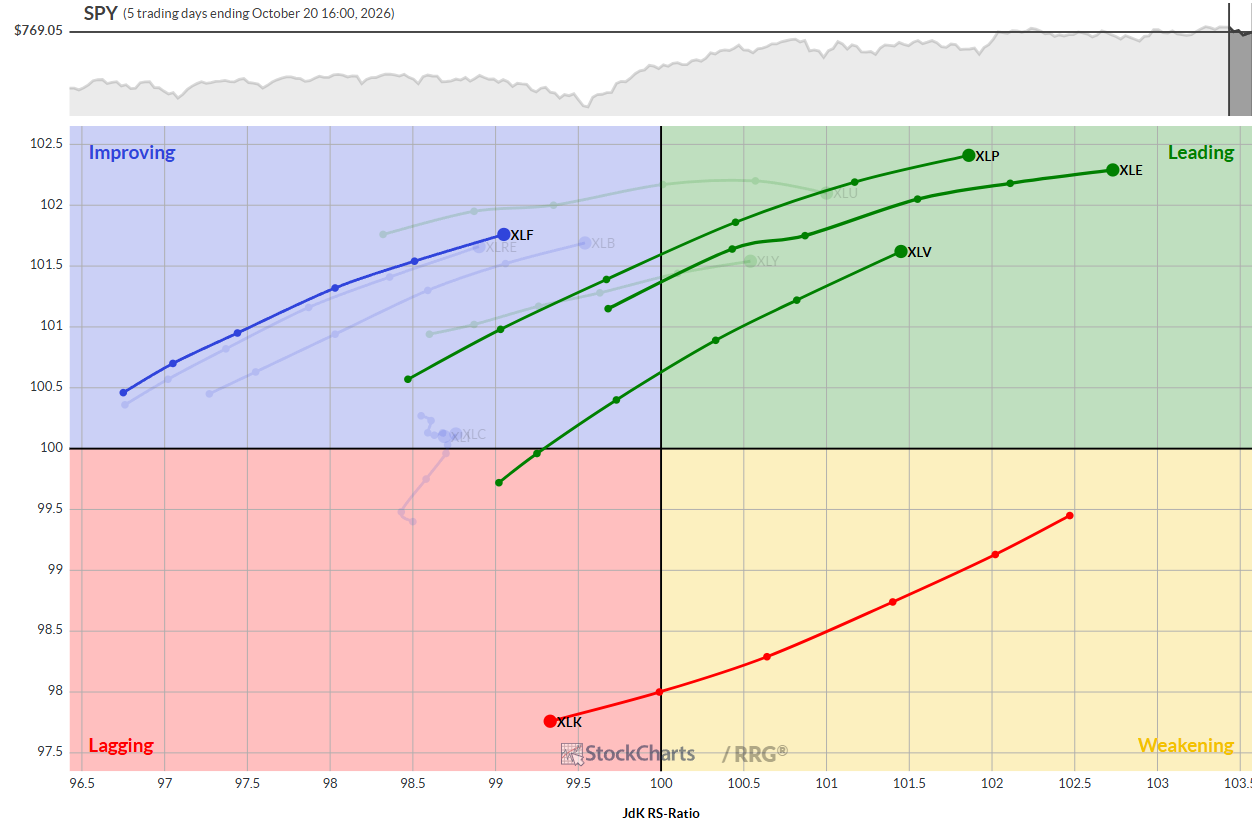
10/19/2026
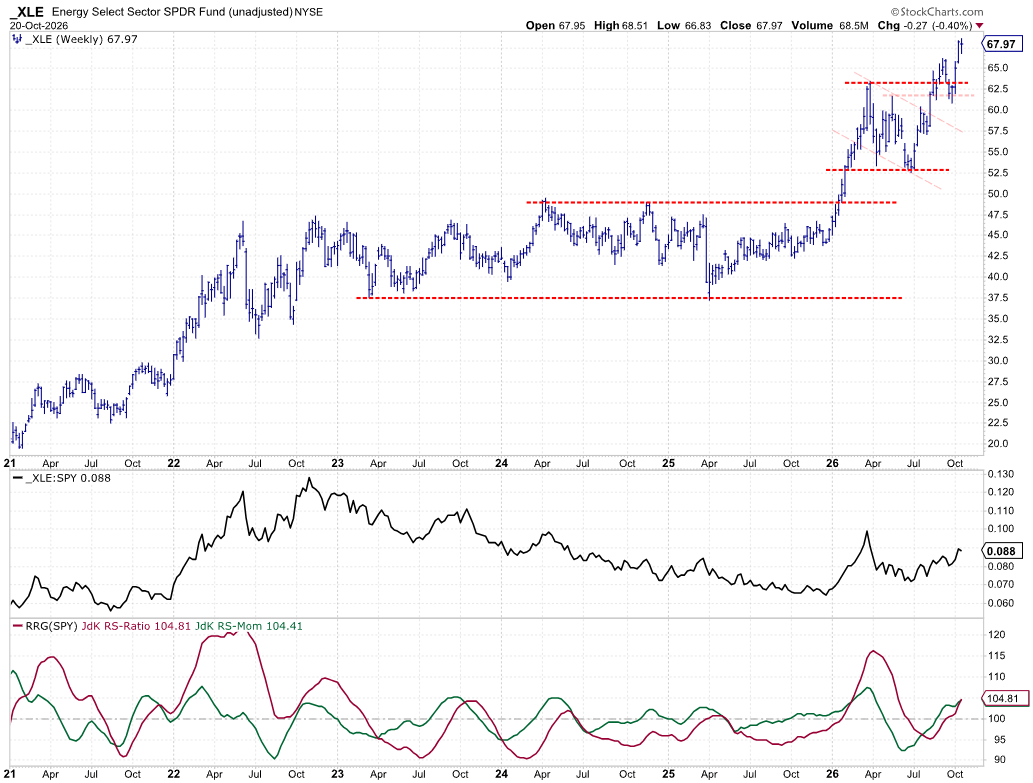
- (3) Energy - XLE [6%]*
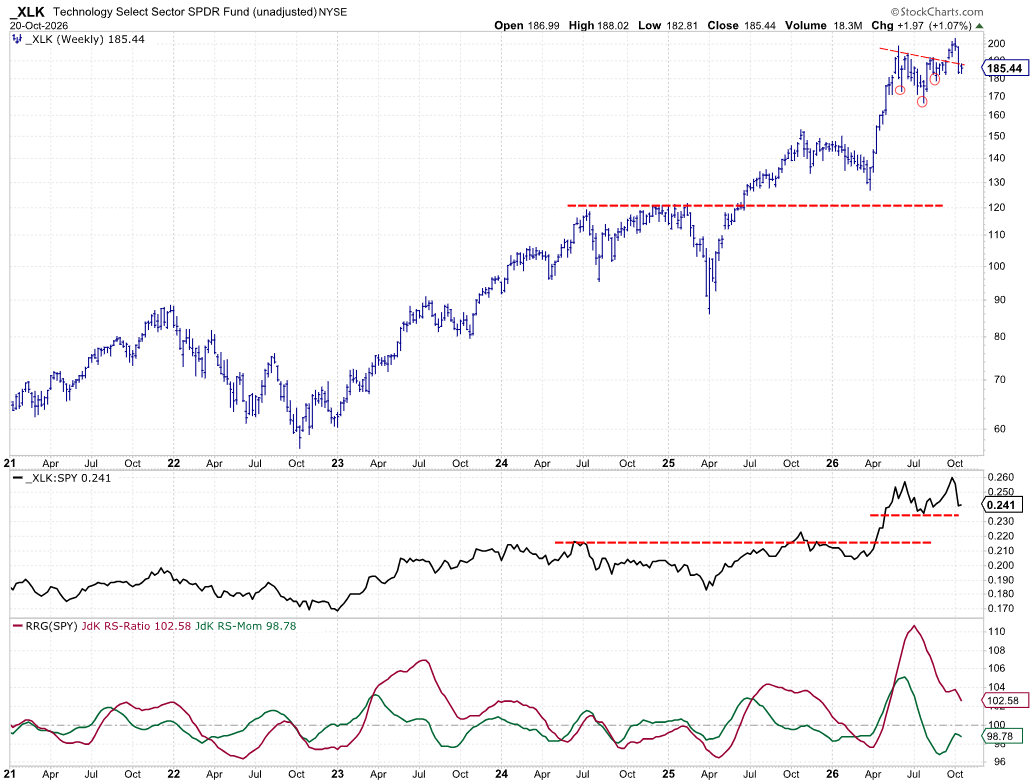
- (1) Technology - XLK [57%]*
- (2) Health Care - XLV [13%]*
- (4) Financials - XLF [17%]
- (7) Consumer Staples - XLP [7%]*
- (8) Consumer Discretionary - XLY*
- (9) Materials - XLB*
- (6) Communication Services - XLC*
- (5) Industrials - XLI [11%]*
- (10) Real Estate - XLRE
- (11) Utilities - XLU
Weekly RRG
Daily RRG
Energy
Technology
Health Care
Financials
Consumer Staples
Portfolio Construction and Performance
#StayAlert, -Julius
Juliusdk@stockcharts.com