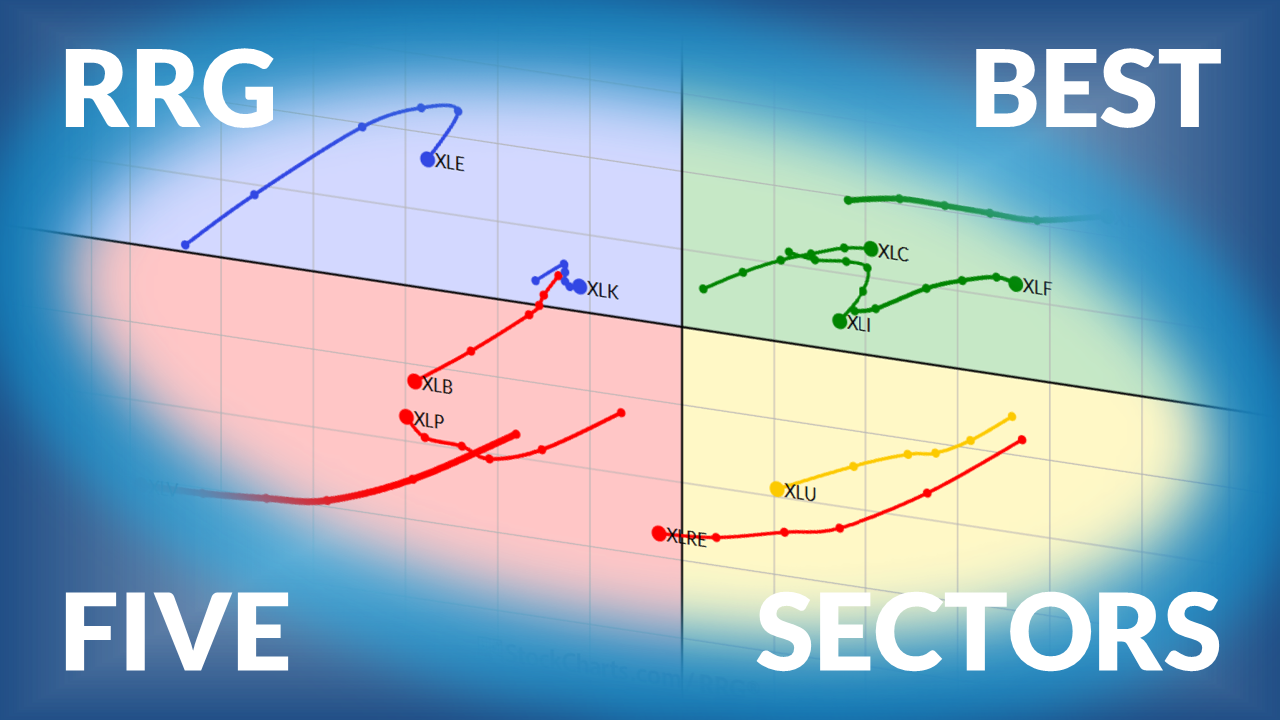
The Best Five Sectors This Week #65
Key Takeaways
- Technology leads the sectors, maintaining strong momentum and staying in the leading quadrant on the RRG chart.
- Energy remains the strongest sector by RS Ratio but shows signs of short-term relative weakness on the daily RRG.
- Materials, Industrials, and Real Estate exhibit sideways movement, with weakening momentum but stable relative strength.
- The cap-weighted portfolio outperformed the S&P 500 last week, narrowing its underperformance gap by nearly 4%.
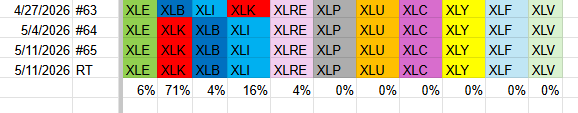
After a week in which the S&P 500 gained over 2%, the composition and ranking of the top five sectors remained unchanged. In fact, the entire sector universe maintained its previous order.
Energy continues to lead at number one, followed by technology, materials, industrials, and real estate. The bottom half includes consumer staples, utilities, communication services, consumer discretionary, financials, and healthcare.
- (1) Energy - XLE [6%]
- (2) Technology - XLK [71%]
- (3) Materials - XLB [4%]
- (4) Industrials - XLI [16%]
- (5) Real Estate - XLRE [4%]
- (6) Consumer Staples - XLP
- (7) Utilities - XLU
- (8) Communication Services - XLC
- (9) Consumer Discretionary - XLY
- (10) Financials - XLF
- (11) Health Care - XLV
Weekly RRG
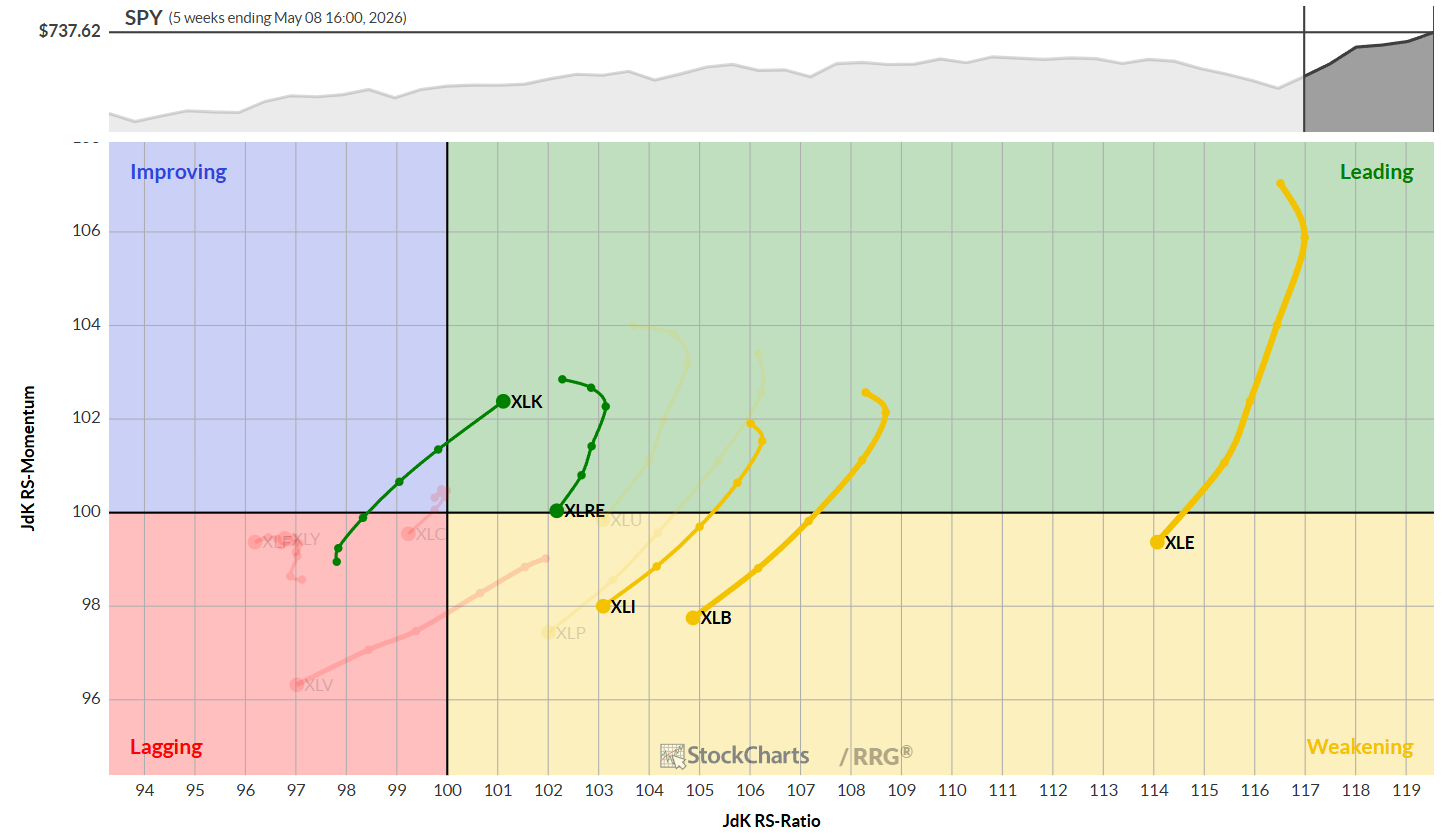
The technology sector has now clearly entered the leading quadrant with a strong heading, marking the strongest rotation in the group. While the other four sectors in the top five, energy, materials, industrials, and real estate, continue their rotation at negative headings through the weakening quadrant, technology stands out. Energy, materials, and industrials are inside the weakening quadrant, and real estate is on the verge of moving into the leading quadrant. All these sectors maintain relatively high RS Ratio readings, keeping them within the top five portfolio.
Daily RRG
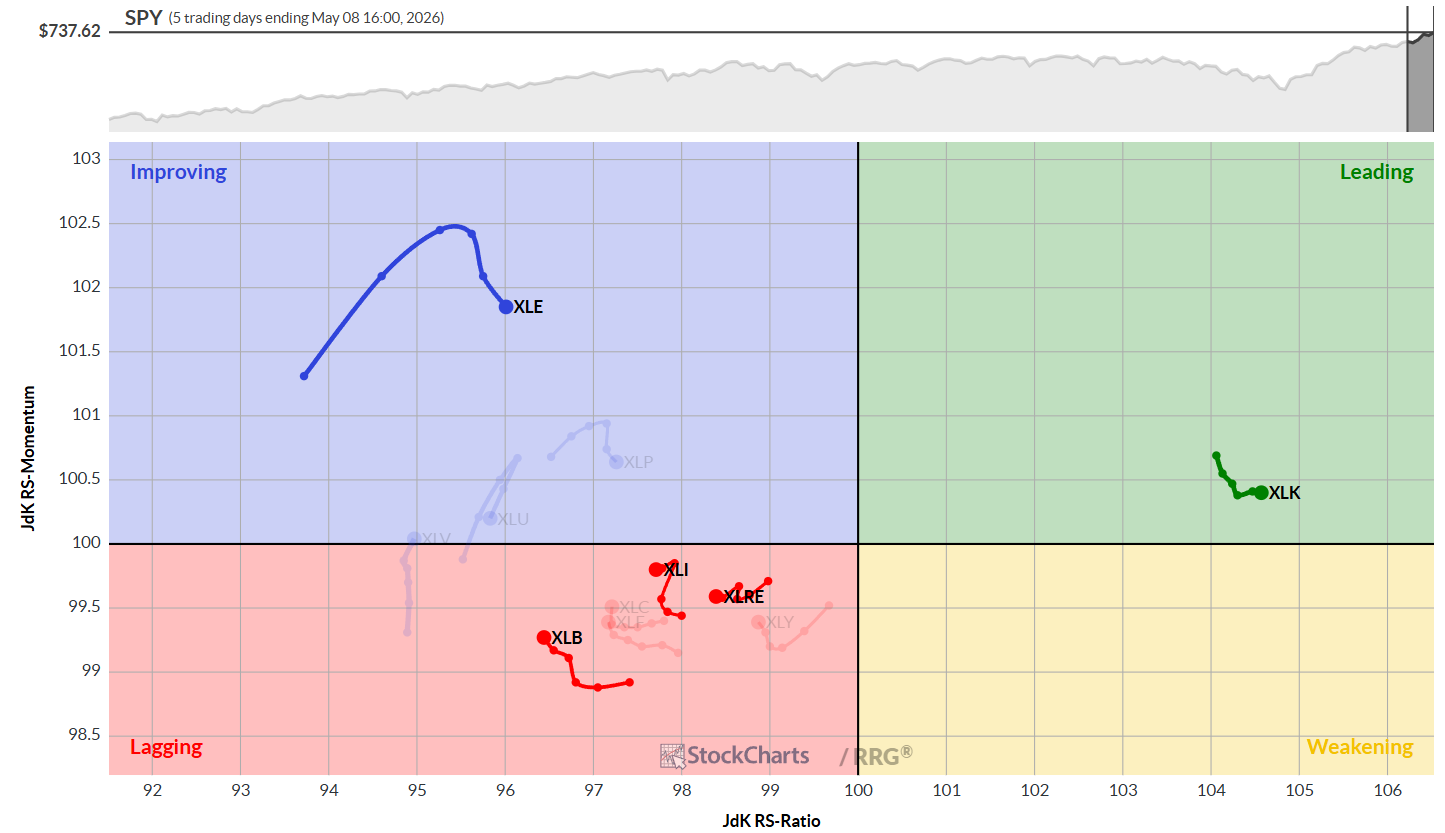
The technology sector remains the only sector inside the leading quadrant. Although it has lost some relative momentum, it continues to move higher on the RS-ratio scale.
In the lagging quadrant, materials, industrials, and real estate have relatively short tails, indicating stable relative performance on the daily timeframe. Materials and industrials are slightly gaining momentum, while real estate remains stable.
Inside the improving quadrant, the energy sector has rolled over and is now moving lower on the RS Momentum scale, but continues to slowly move higher on the RS-ratio scale.
There is still room for energy to pick up and return to the leading quadrant, supporting a positive outlook for the sector as seen on the weekly RRG.
Energy
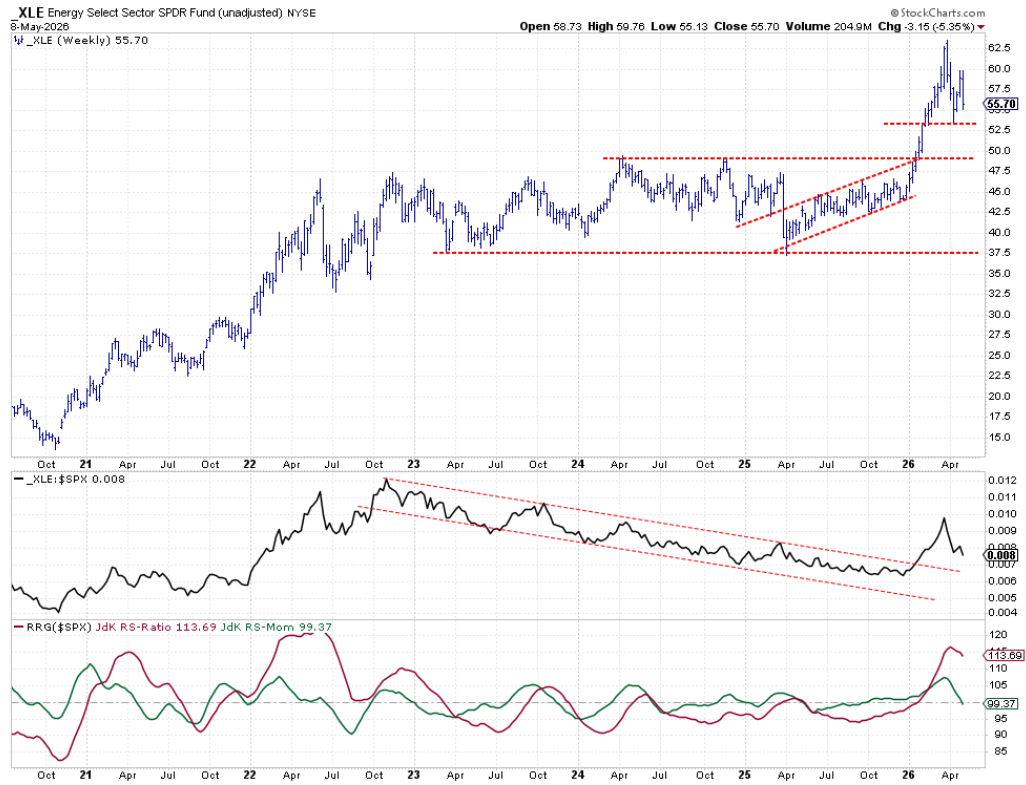
Energy seems to have established a lower high after a higher low, suggesting the price chart is moving sideways. The raw RS line is beginning to trend downward. Although the sector broke out of the long-term falling trend channel, its current relative weakness will take more time to resolve.
The RRG lines are rolling over, with the RS-ratio still at a high reading and the RS-momentum crossing below 100, positioning the tail inside the weakening quadrant. Based on the RS-ratio, energy remains the strongest sector.
Technology
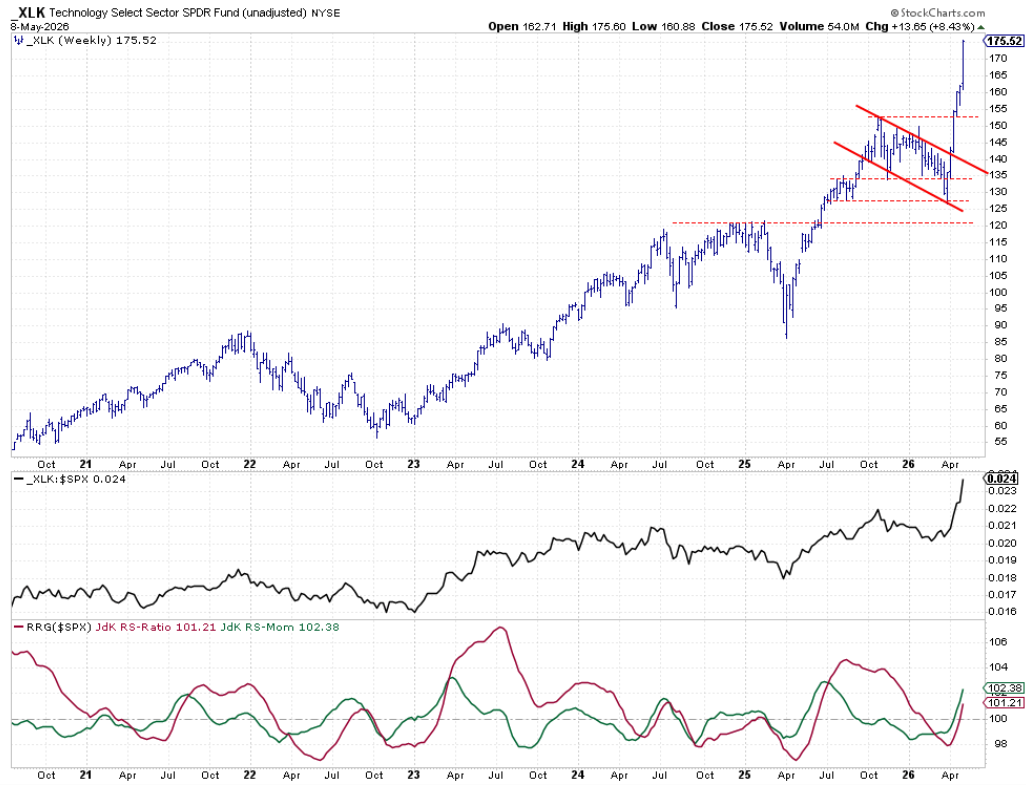
The technology rally continues at a rapid pace. Last week, the sector reached a new high and ended near it, signaling strength. The raw RS line continues higher after breaking its previous high, and both RRG lines are pushing above 100, supporting a strong heading and continued leadership for technology.
Materials
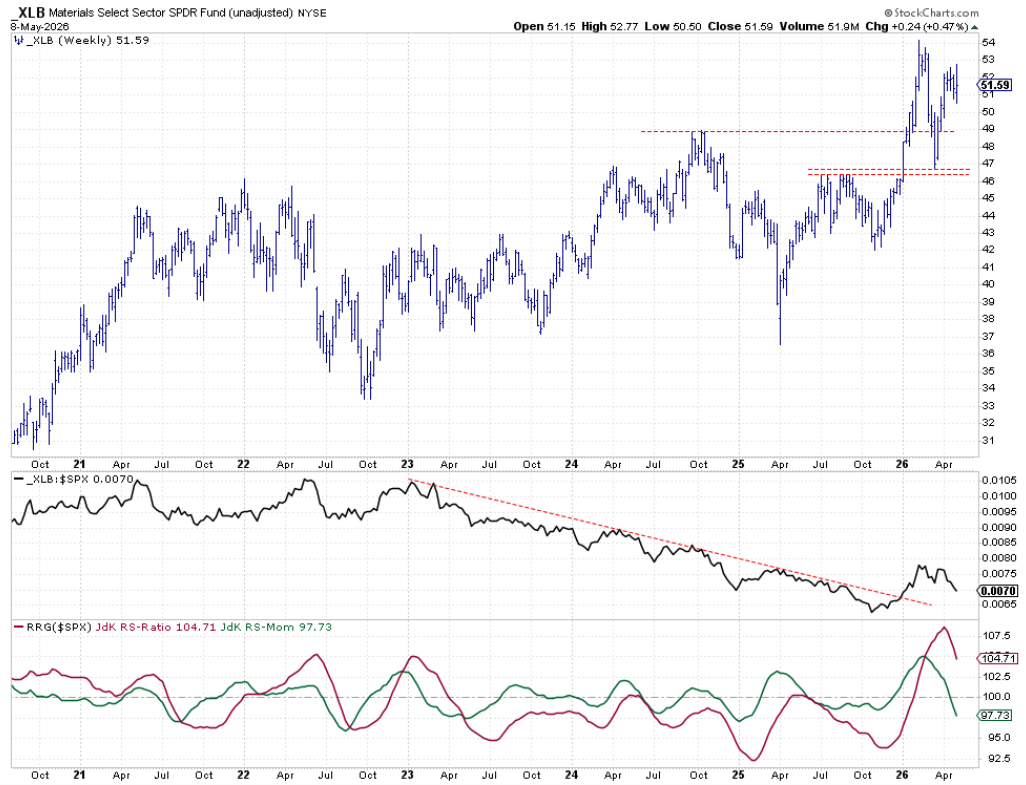
Materials are starting to move sideways on the price chart. The raw RS line has formed a small double-top pattern, indicating potential relative weakness in the coming weeks. This results in RRG lines pointing lower, with RS Momentum clearly below 100, dragging the RS-ratio down. However, the RS-ratio keeps materials inside the top five.
Industrials
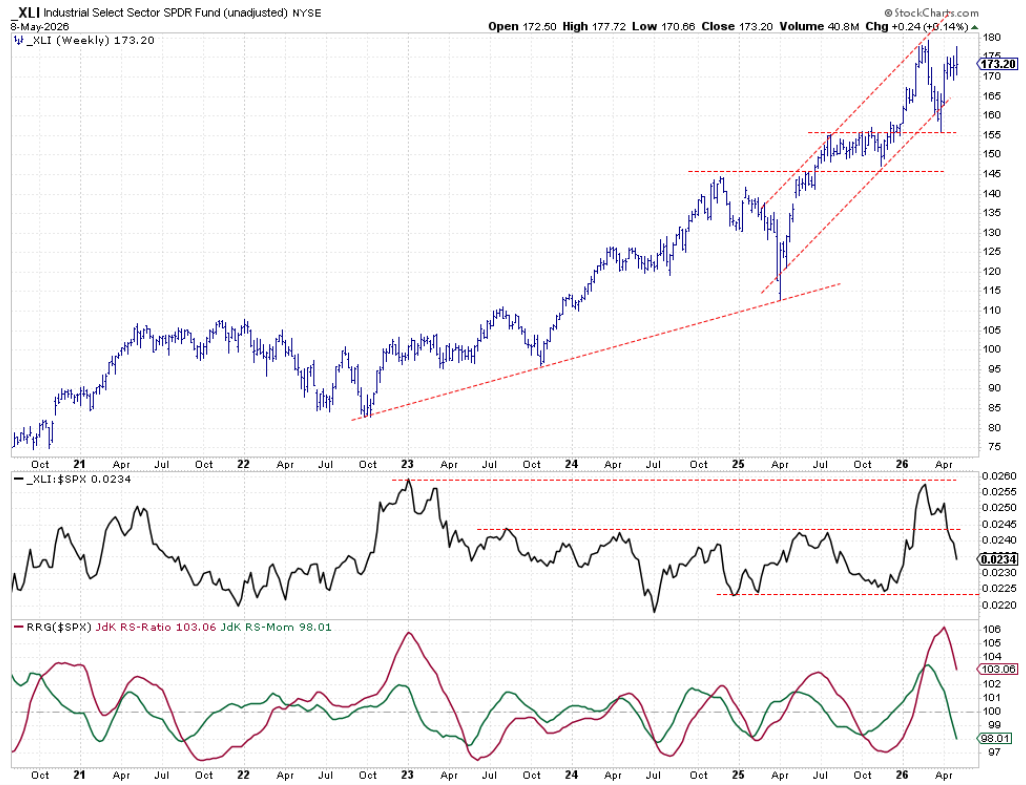
Industrials have also started to move sideways, contained within a range over the last three to four weeks. Raw relative strength is now in a rhythm of lower highs and lower lows, pushing back into the trading range seen over the past few years. The RRG lines have rolled over, with RS Momentum already below 100 and RS-ratio above, but clearly moving through the weakening quadrant on the weekly RRG.
Real Estate
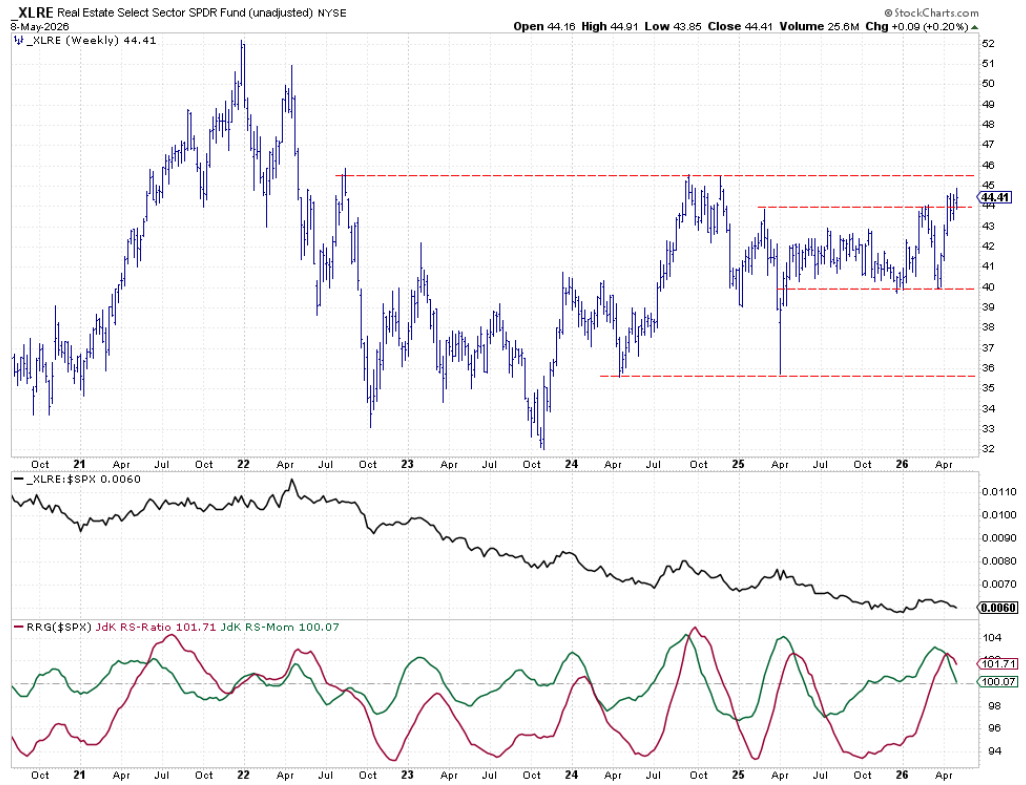
Real estate, the last sector in the top five, is holding up well above the breakout level, which is positive. However, it is very close to the next resistance level around 45.50. The raw RS line remains in a rhythm of lower highs and lower lows, with the possibility of a first higher low, higher than the low set at the end of 2025. The RRG lines remain close to home, on the verge of pushing the tail into the weakening quadrant.
Portfolio Performance
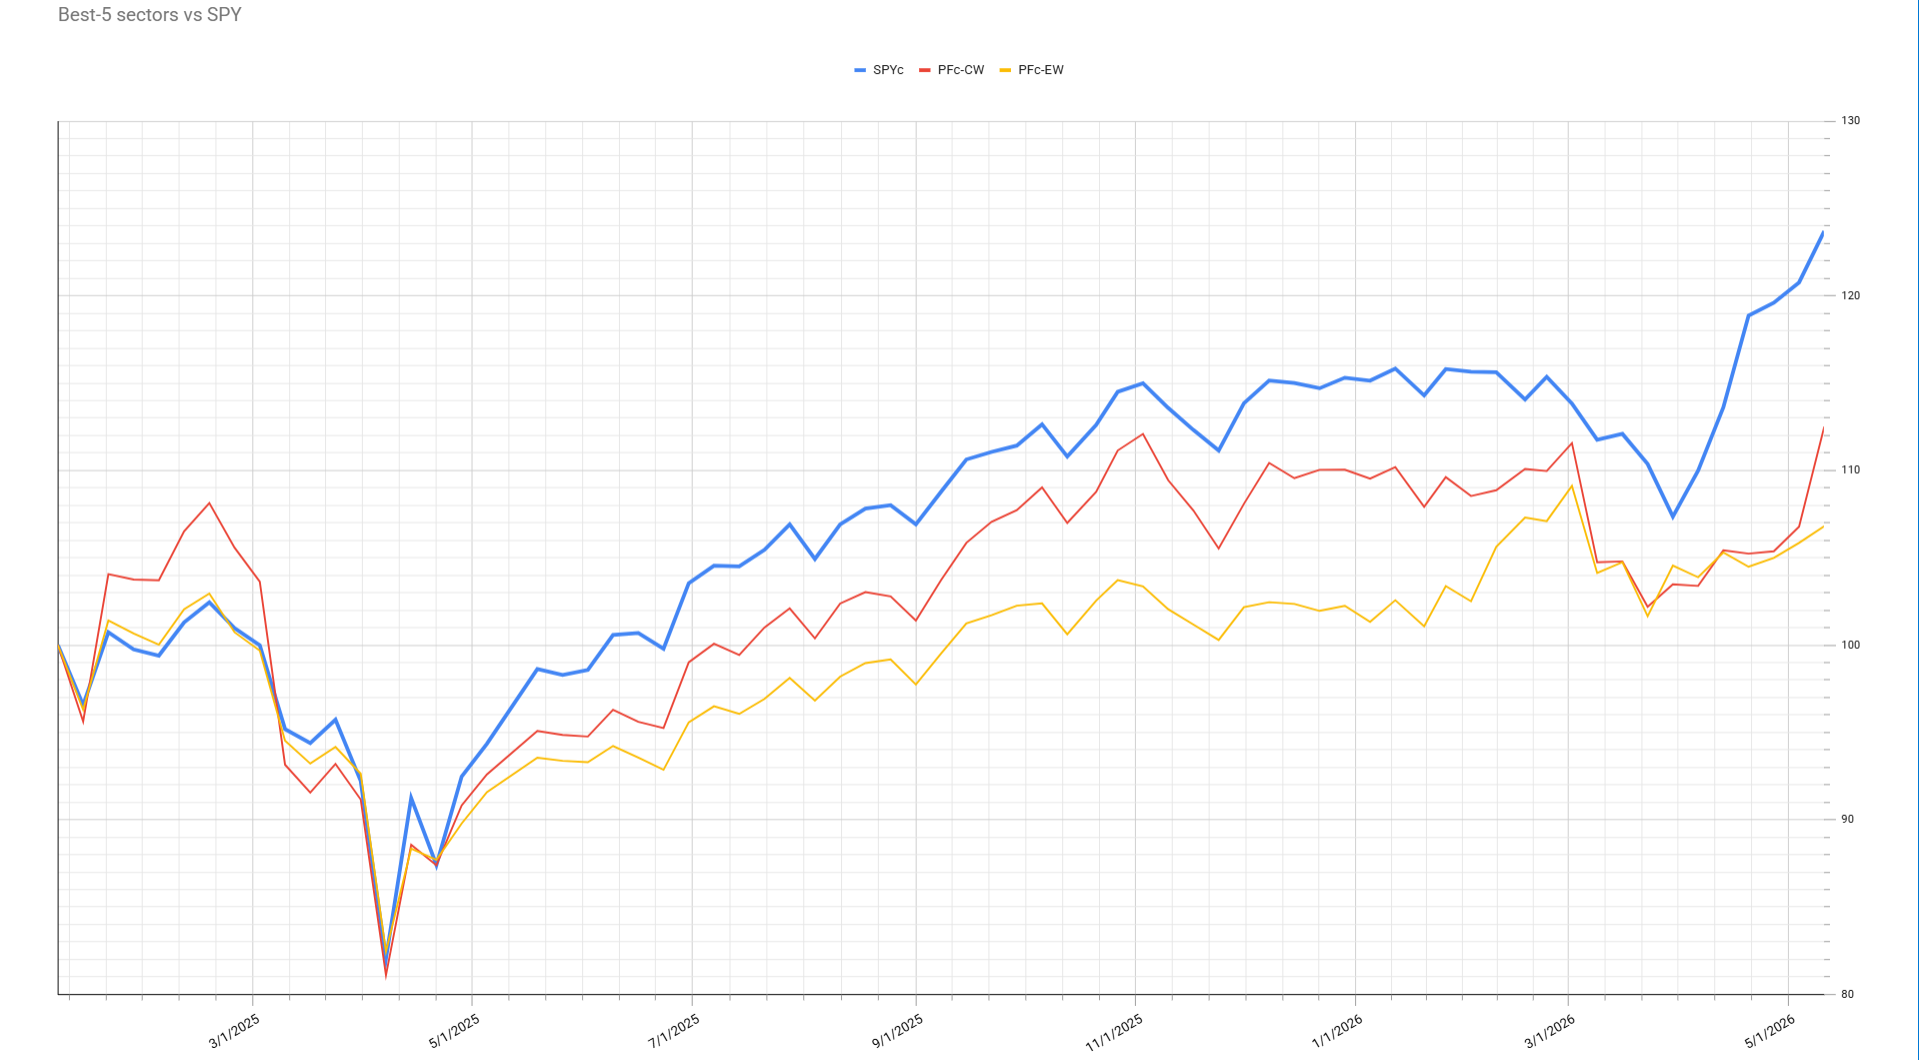
Last week saw a strong performance, especially for the cap-weighted portfolio. It demonstrated how a portfolio weighted by sector market capitalization can catch up to the S&P 500 really fast. In fact, the portfolio outperformed the S&P 500, narrowing the lag by almost 4%. These swings in performance can happen quickly when the portfolio is correctly positioned based on market performance. While there is still a long way to go to catch up with the S&P 500, weeks like this are beneficial for overall performance.
StayAlert, -Julius