The Best Five Sectors This Week #68
Key Takeaways
- Technology sector leads the rankings, being solidly in the leading quadrant on weekly RRG, driving portfolio performance.
- Energy drops to second position, showing signs of weakening momentum and heading towards the lagging quadrant.
- Real estate enters the top five, supported by price chart strength despite RRG lines moving lower.
- Cap-weighted portfolio narrows its gap with the S&P 500, driven by technology's 71% weight.
Technology Takes the Lead
In the week ending May 29th, the S&P 500 gained approximately 1.5%, resulting in some shifts among sector rankings. Here’s a breakdown of the latest changes.
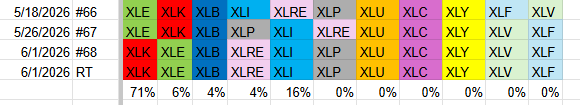
- Technology has claimed the top spot, moving up from second place. This shift pushed the energy sector down to number two.
- Materials remain steady at third position.
- Real estate has entered the top five, rising from sixth to fourth.
Industrials have held their ground at fifth.
As a result, consumer staples dropped out of the top five and now sits in sixth place. The remaining sectors are unchanged: utilities at seven, followed by communication services, consumer discretionary, healthcare, and financials at the bottom.
- (2) Technology - XLK [71%]*
- (1) Energy - XLE [6%]*
- (3) Materials - XLB [4%]
- (6) Real Estate - XLRE [4%]*
- (5) Industrials - XLI [16%]
- (4) Consumer Staples - XLP*
- (7) Utilities - XLU
- (8) Communication Services - XLC
- (9) Consumer Discretionary - XLY
- (10) Health Care - XLV
- (11) Financials - XLF
Weekly RRG
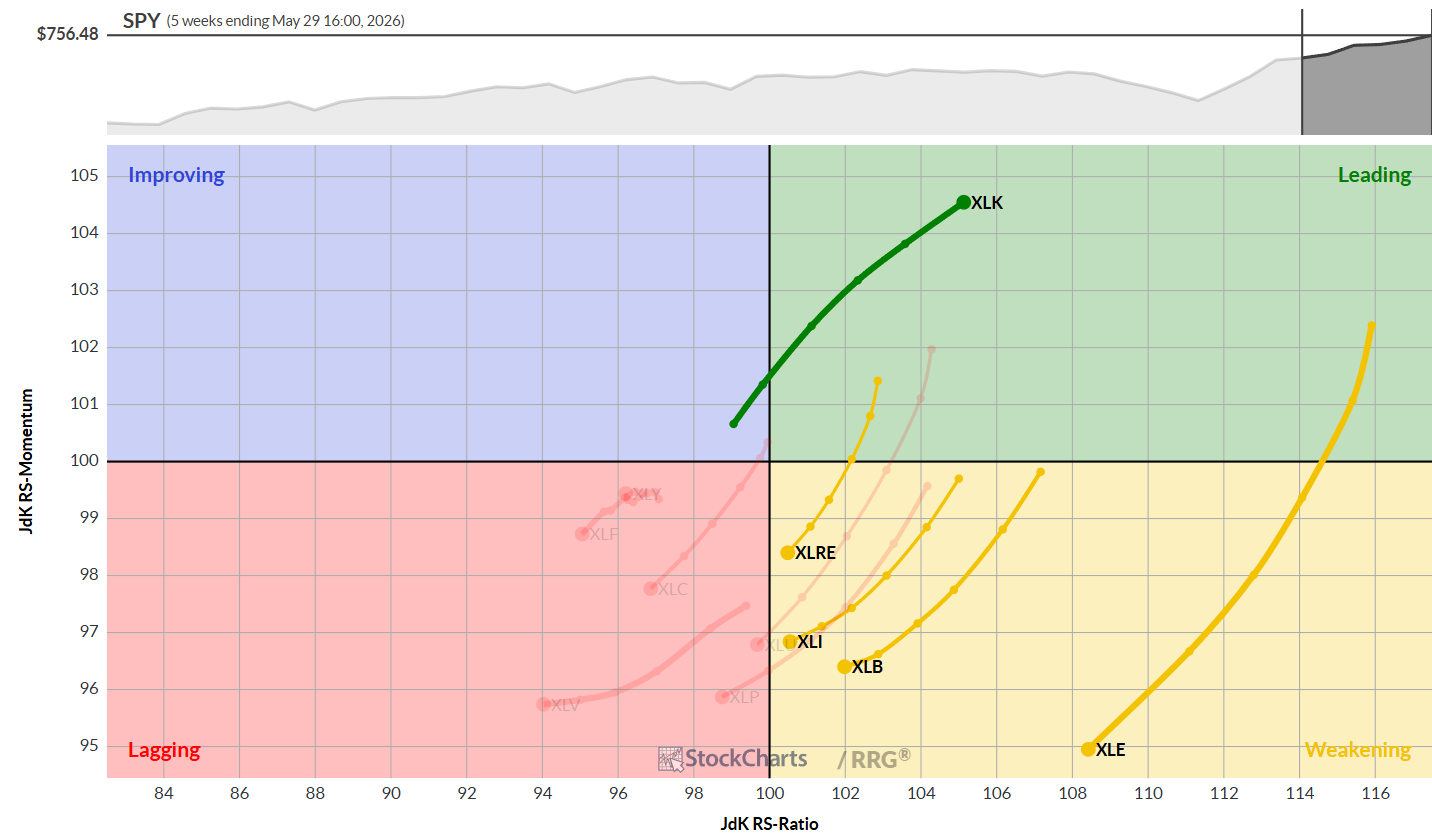
The weekly Relative Rotation Graph (RRG) continues to show technology firmly in the leading quadrant, making it the only sector in that position. The other top five sectors, those being energy, materials, industrials, and real estate, are all in the weakening quadrant, heading toward lagging.
Daily RRG
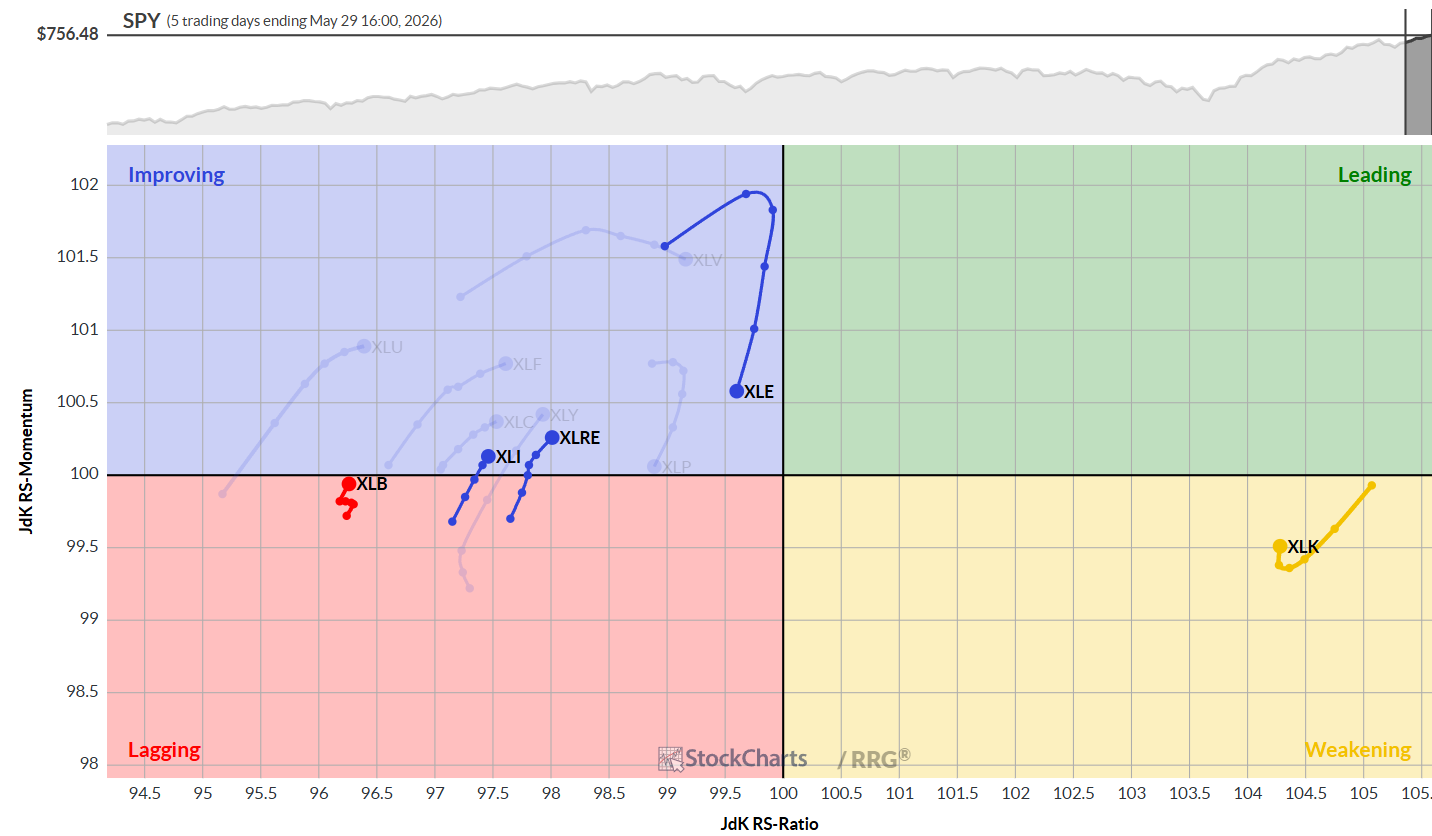
On the daily RRG, technology is inside the weakening quadrant after rotating out of leading, but it’s showing a first hook back up, indicating a potential return to leadership. XLK is the only sector on the right side of the graph, confirming its current strength.
On the left side, energy, real estate, and industrials are in the improving quadrant. Energy has rotated lower without entering the leading quadrant and is now pointing toward lagging. Real estate and industrials are entering the improving quadrant with a positive heading, suggesting they may move back toward leadership. Materials, currently the lowest-ranked sector on the daily RRG, is starting to improve and may soon cross into the improving quadrant.
Sector Performance Highlights
Technology
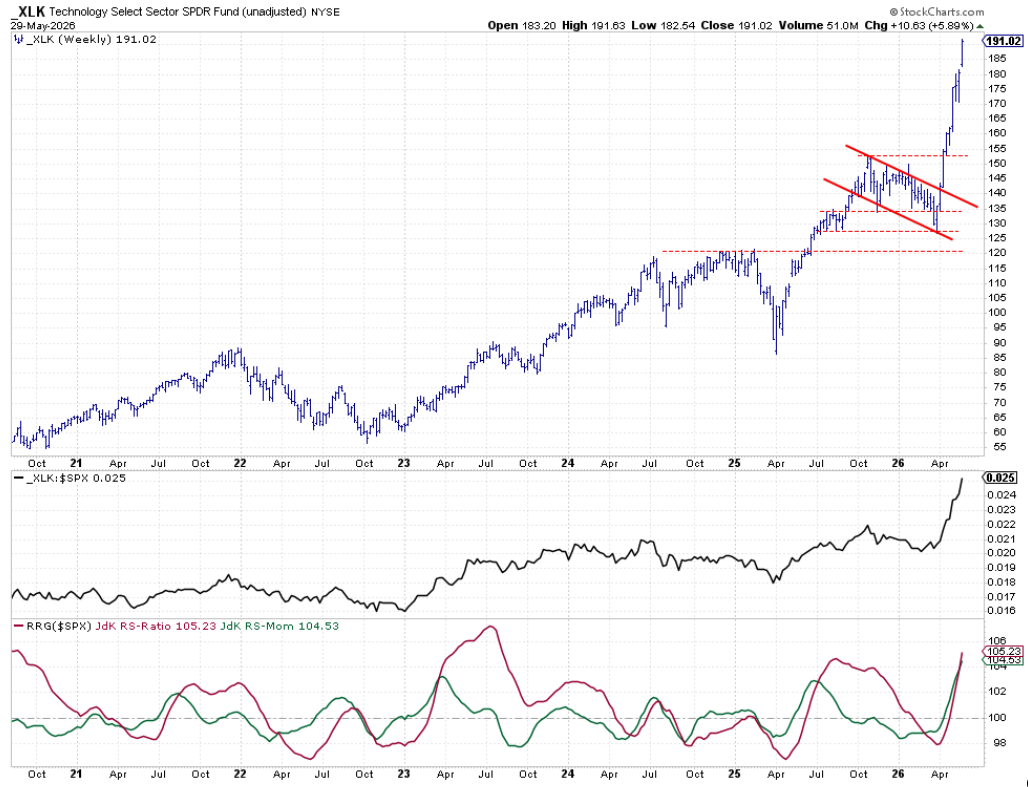
The technology sector’s price chart continues to climb, with last week’s close near the high of the bar. This upward movement is reflected in the raw relative strength line and both RRG lines, which remain strongly positive.
Energy
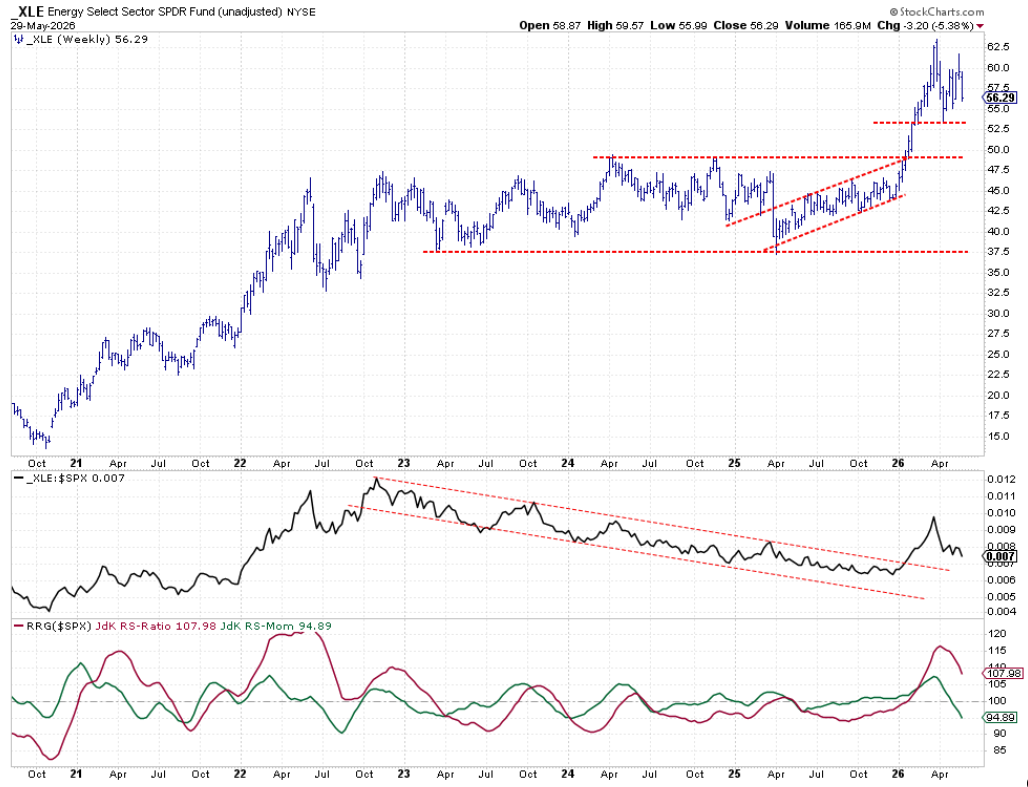
Energy dropped to second place due to price stabilization and a decline last week, with XLE closing just above 56. The raw RS line is stabilizing and has room to decline before turning negative. RRG lines are moving lower, but the RS Ratio line still has space before crossing below 100.
Materials
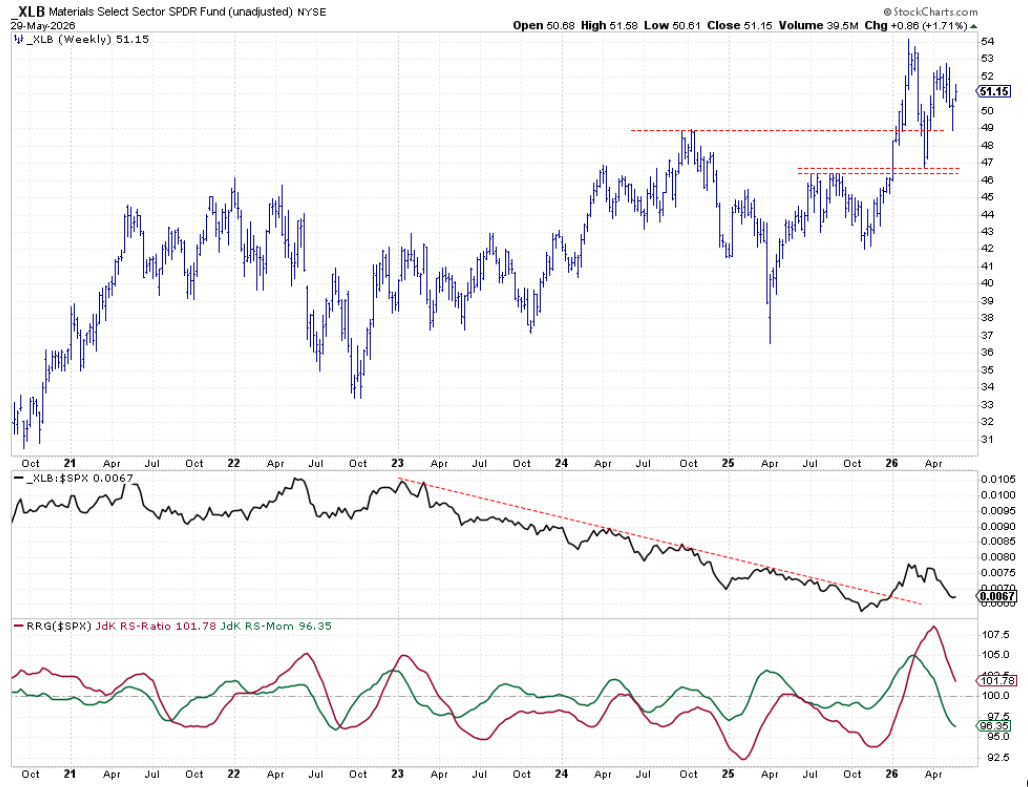
Materials had a solid week, but the broader trend is sideways. Relative strength has stabilized and, if materials can establish a new low at current levels, it could mark a higher low and signal a return to a relative uptrend.
Real Estate
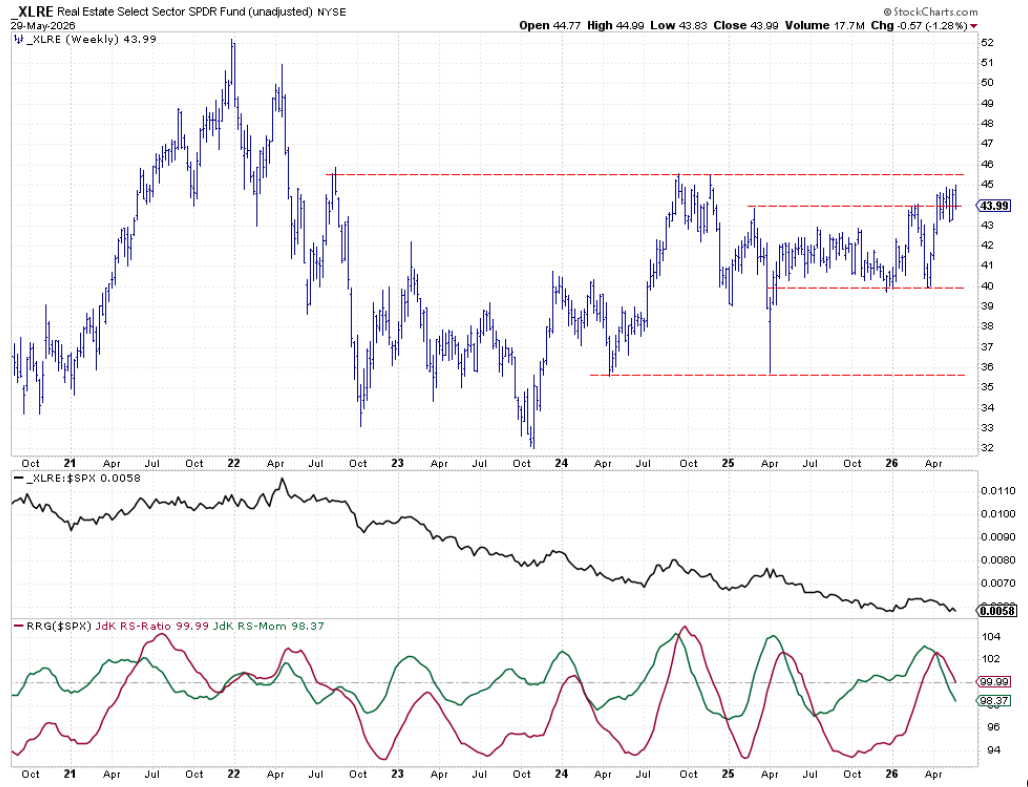
Real estate, now in the top five, is holding up well after breaking above resistance around 43.5–44. However, overhead resistance remains just above 45. The raw RS line is above its relative low from last year and, while RRG lines are moving lower, the sector’s entry into the top five suggests its daily and weekly RRG values outperform other sectors.
Industrials
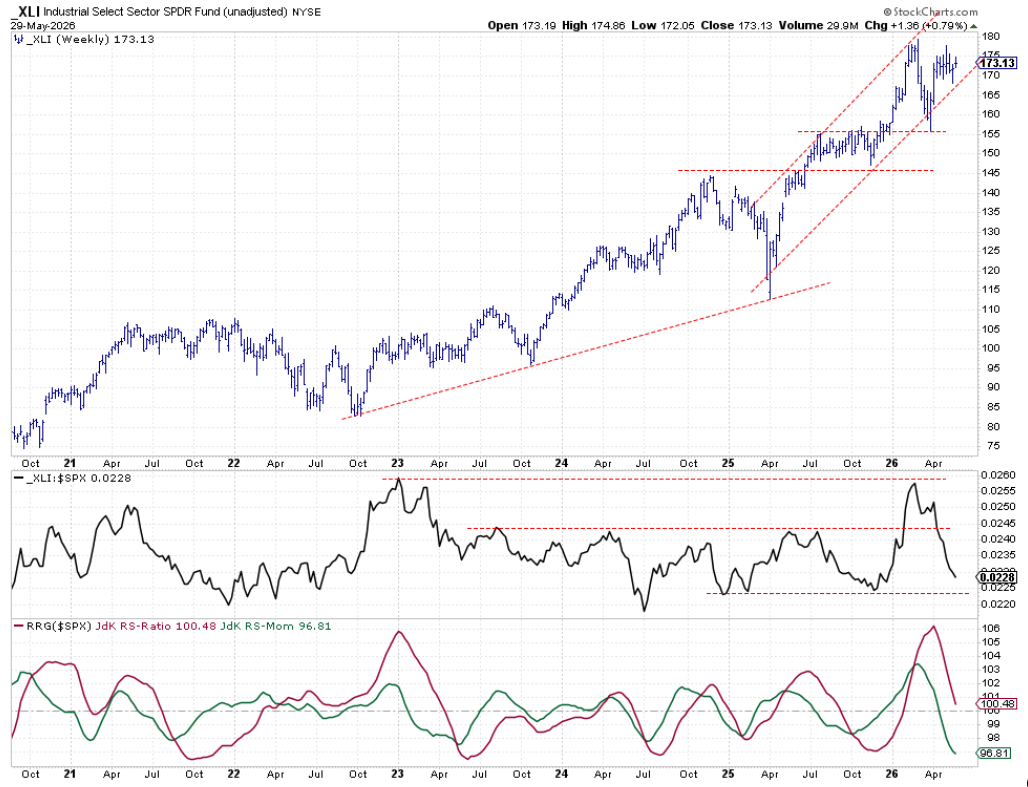
Industrials continue in a sideways pattern, now lasting almost two months, but still within a rising trend channel. The raw RS line has moved lower, approaching horizontal support from relative lows set in 2025. RRG lines are declining, and the RS ratio line is close to crossing below 100, which would push industrials into the lagging quadrant. Despite this, daily and weekly RRG values keep the sector in the top five for now.
Portfolio Composition and Performance
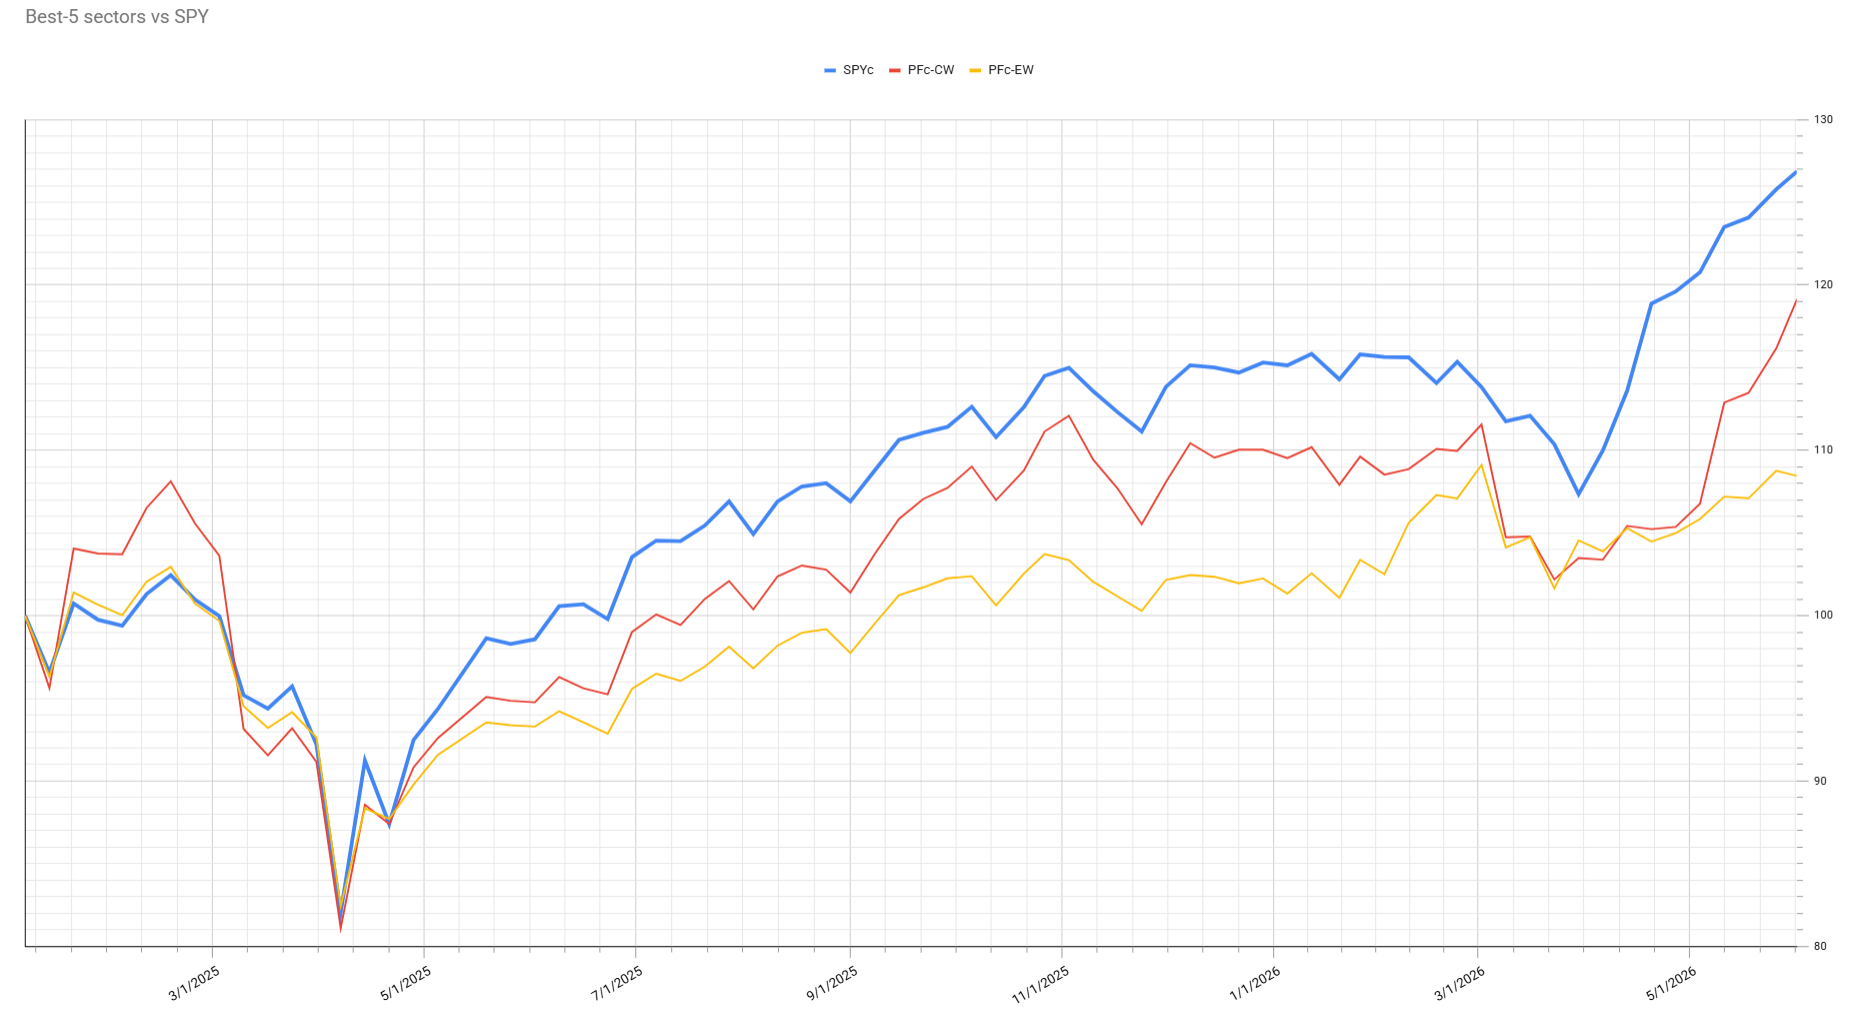
The technology sector now dominates the portfolio, accounting for 71% of the cap-weighted allocation model. The portfolio comparison graph shows the cap-weighted portfolio rapidly catching up with the S&P 500. Relative performance improved by 2.5% over the last week, narrowing the gap between the S&P 500 and this portfolio to 7%, down from over 14% five weeks ago.
For continued improvement, support from the technology sector is crucial, given its significant 70% weighting in the portfolio.
Conclusion
Technology’s rise to the top of the sector rankings is driving portfolio performance and reshaping the S&P 500 landscape. While other sectors show signs of improvement, technology’s dominance means its continued strength will be key to further gains. I will continue to keep a close eye on sector rotations and relative strength trends and update this model as the market evolves.
#StayAlert, -Julius