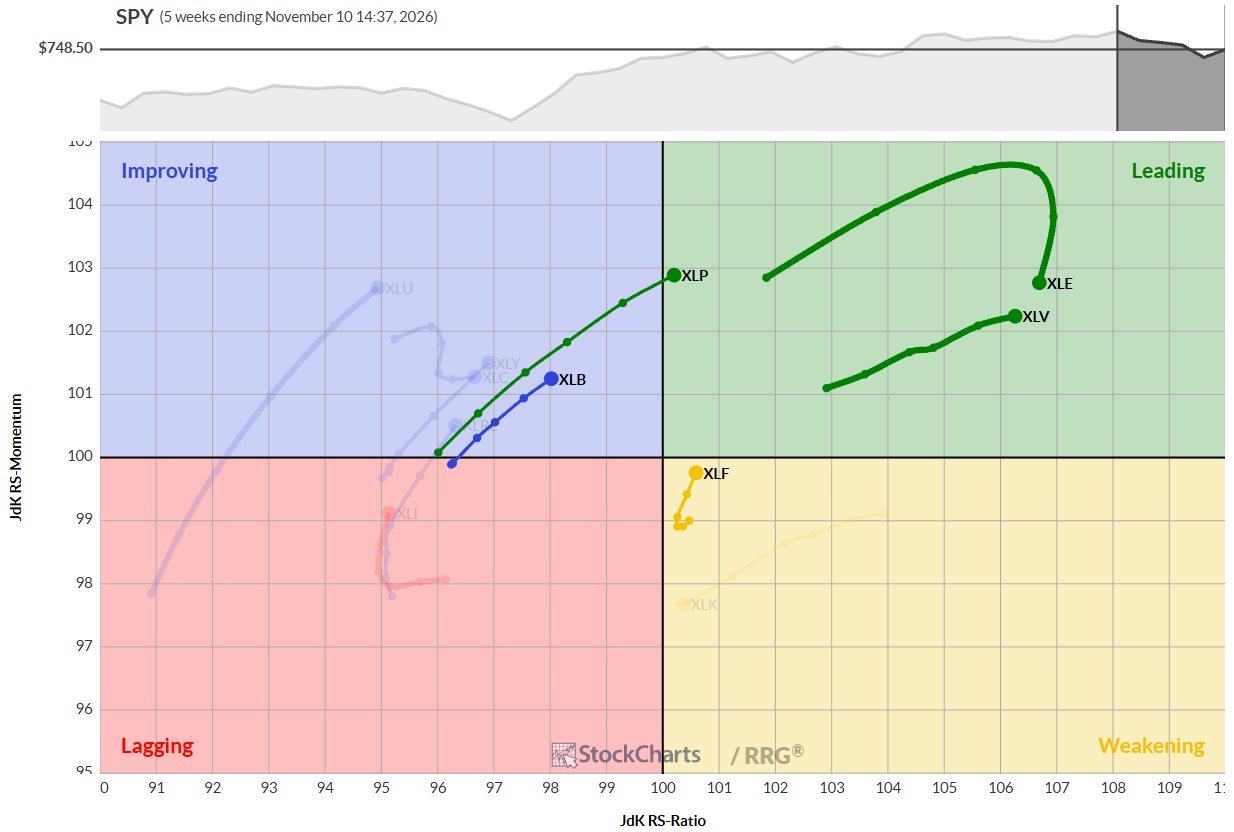
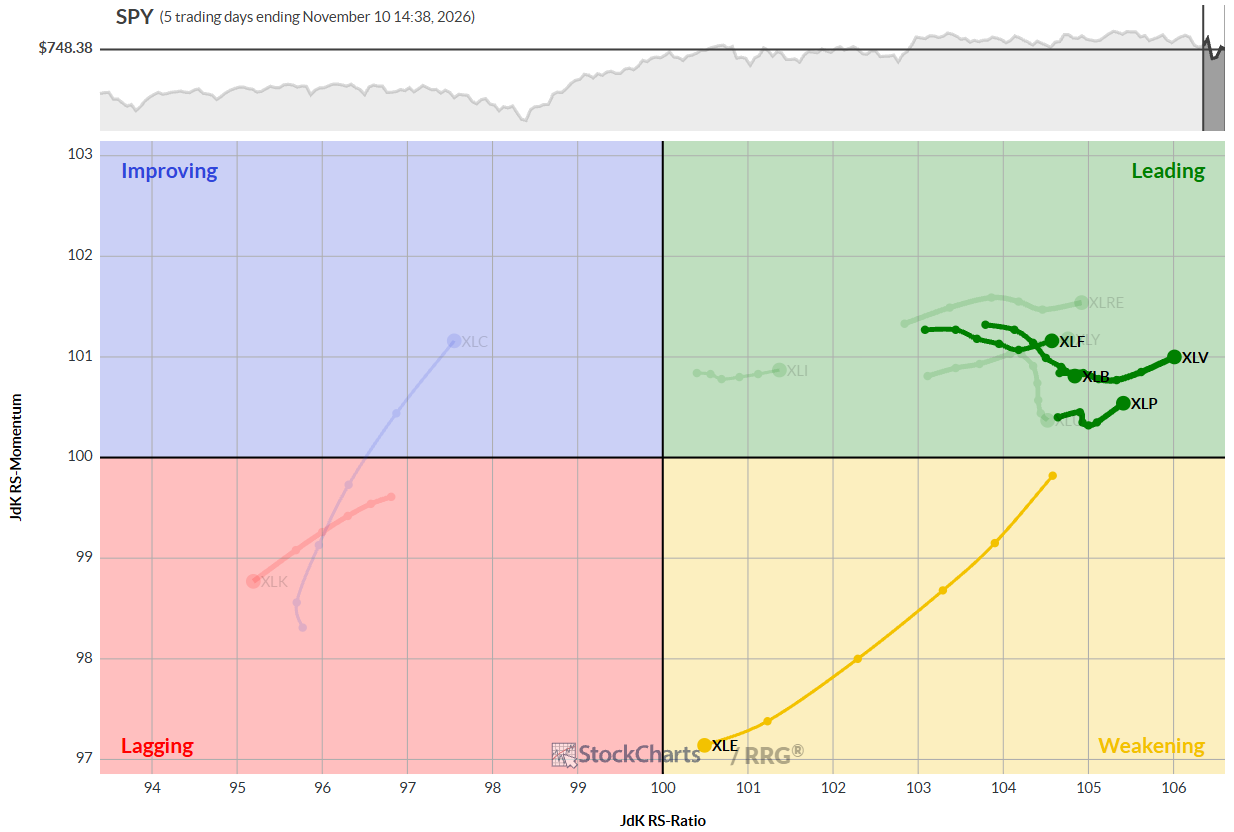
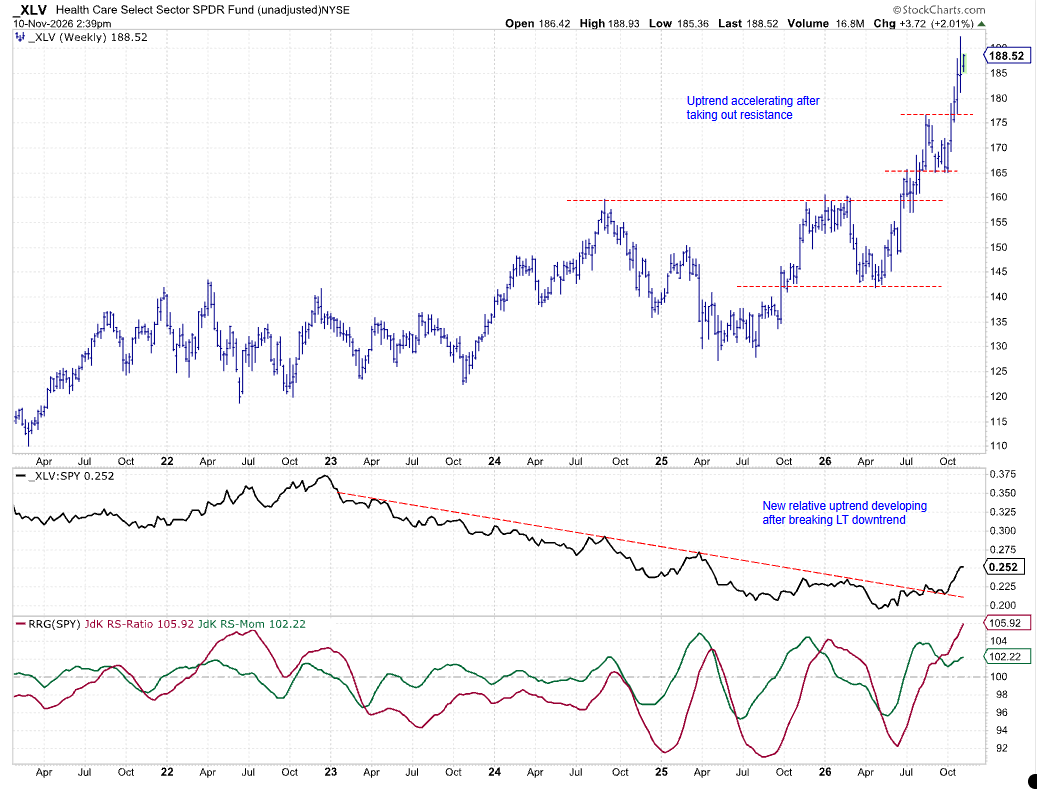
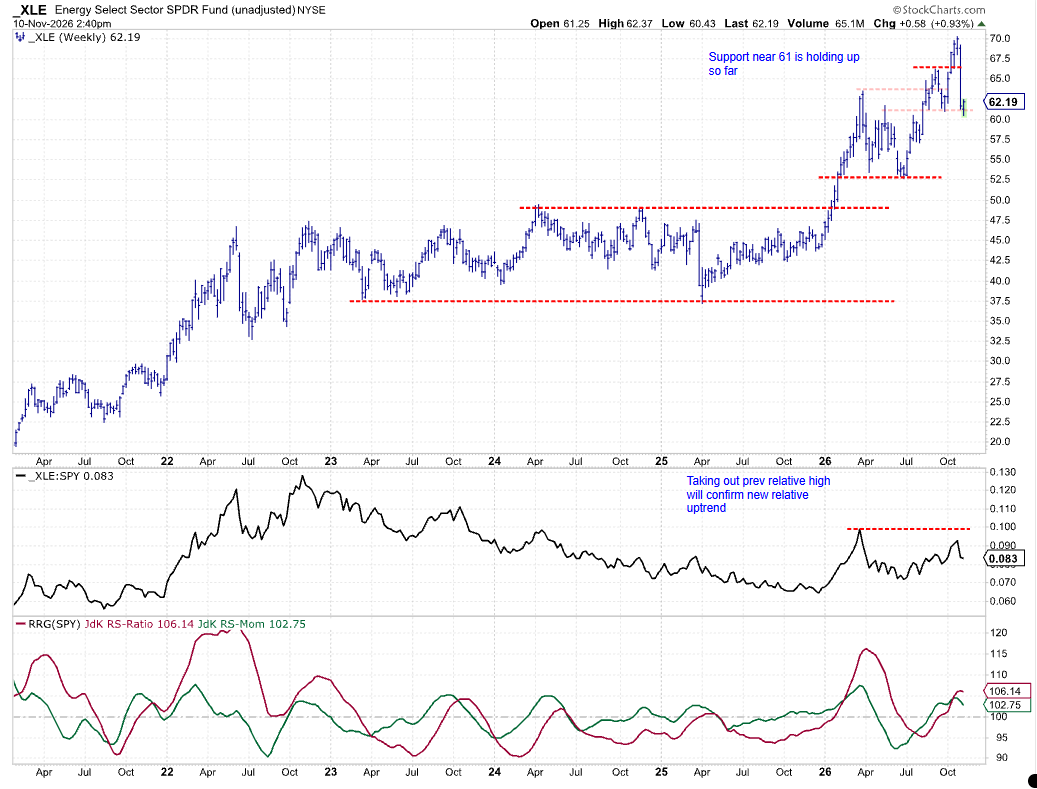
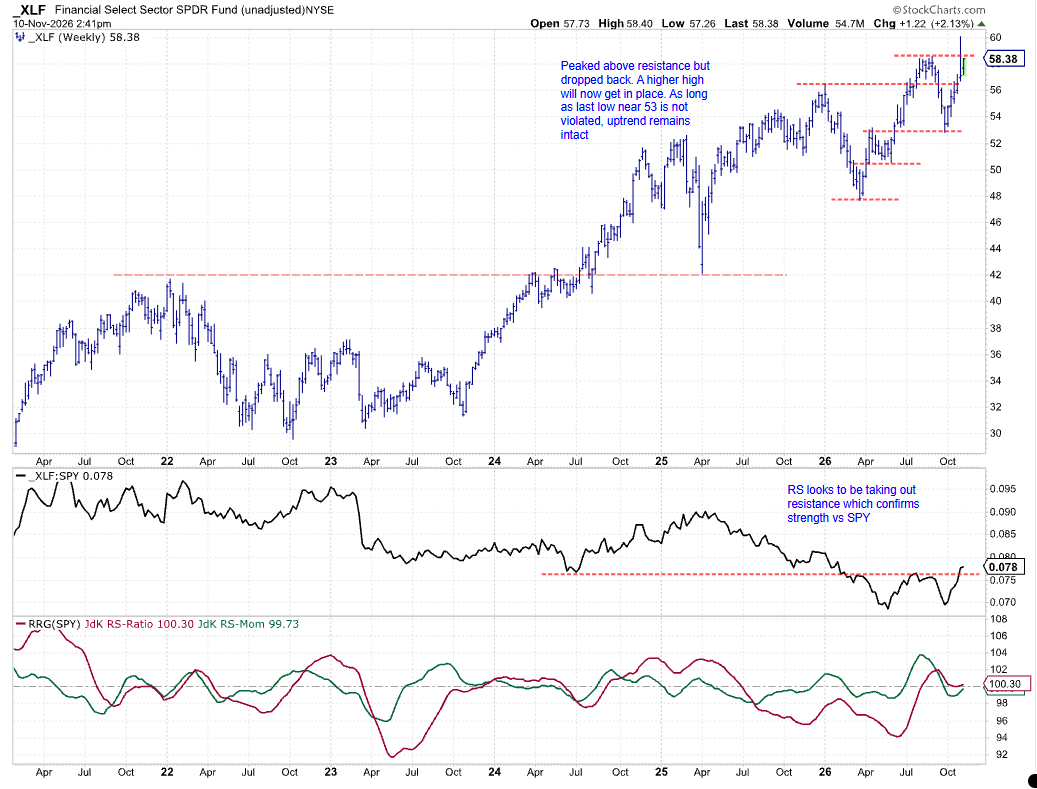
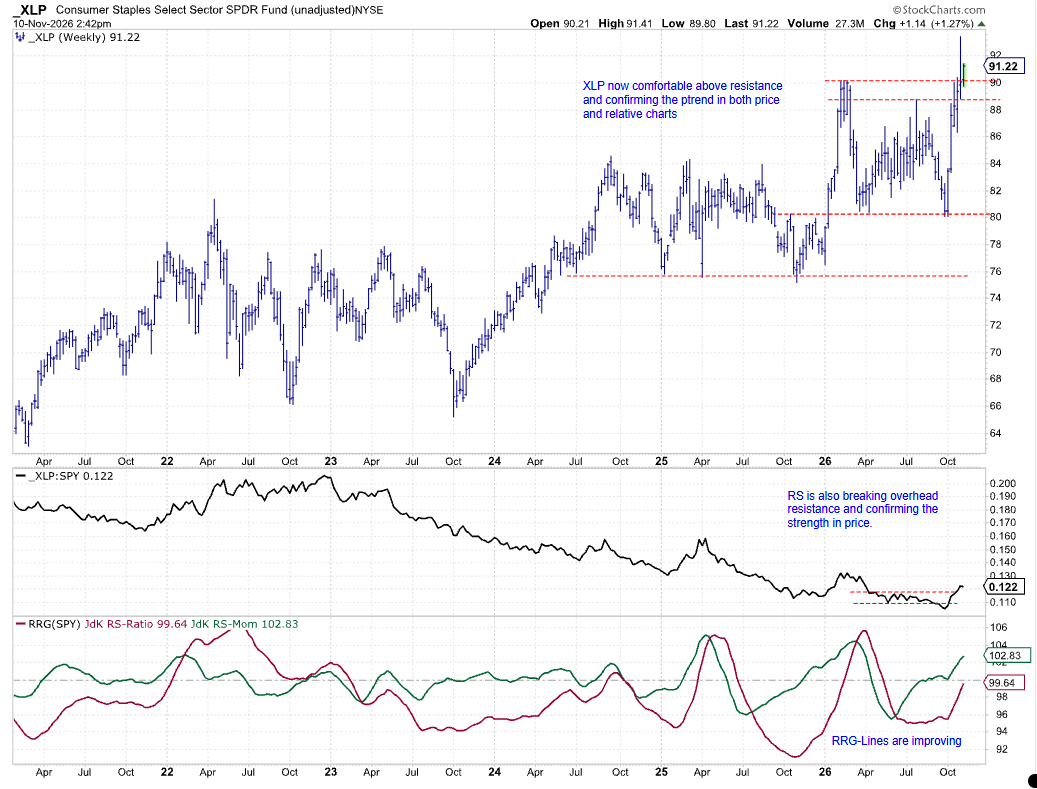
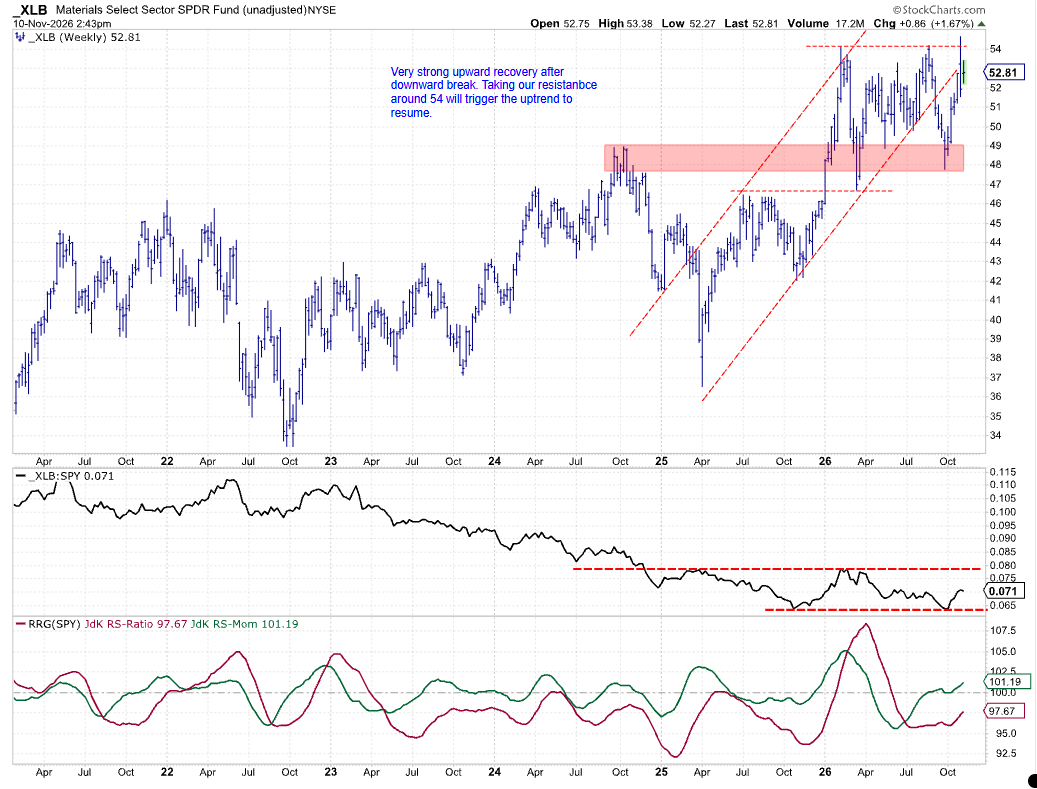
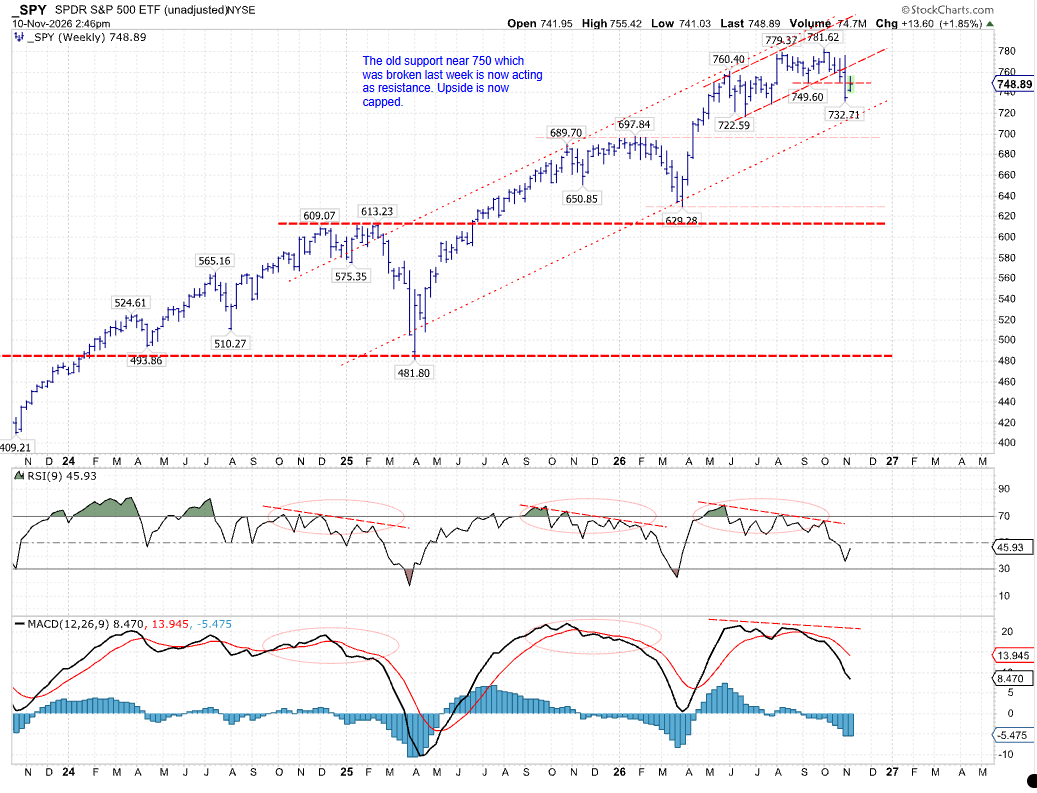
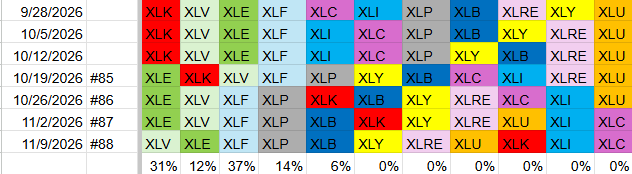
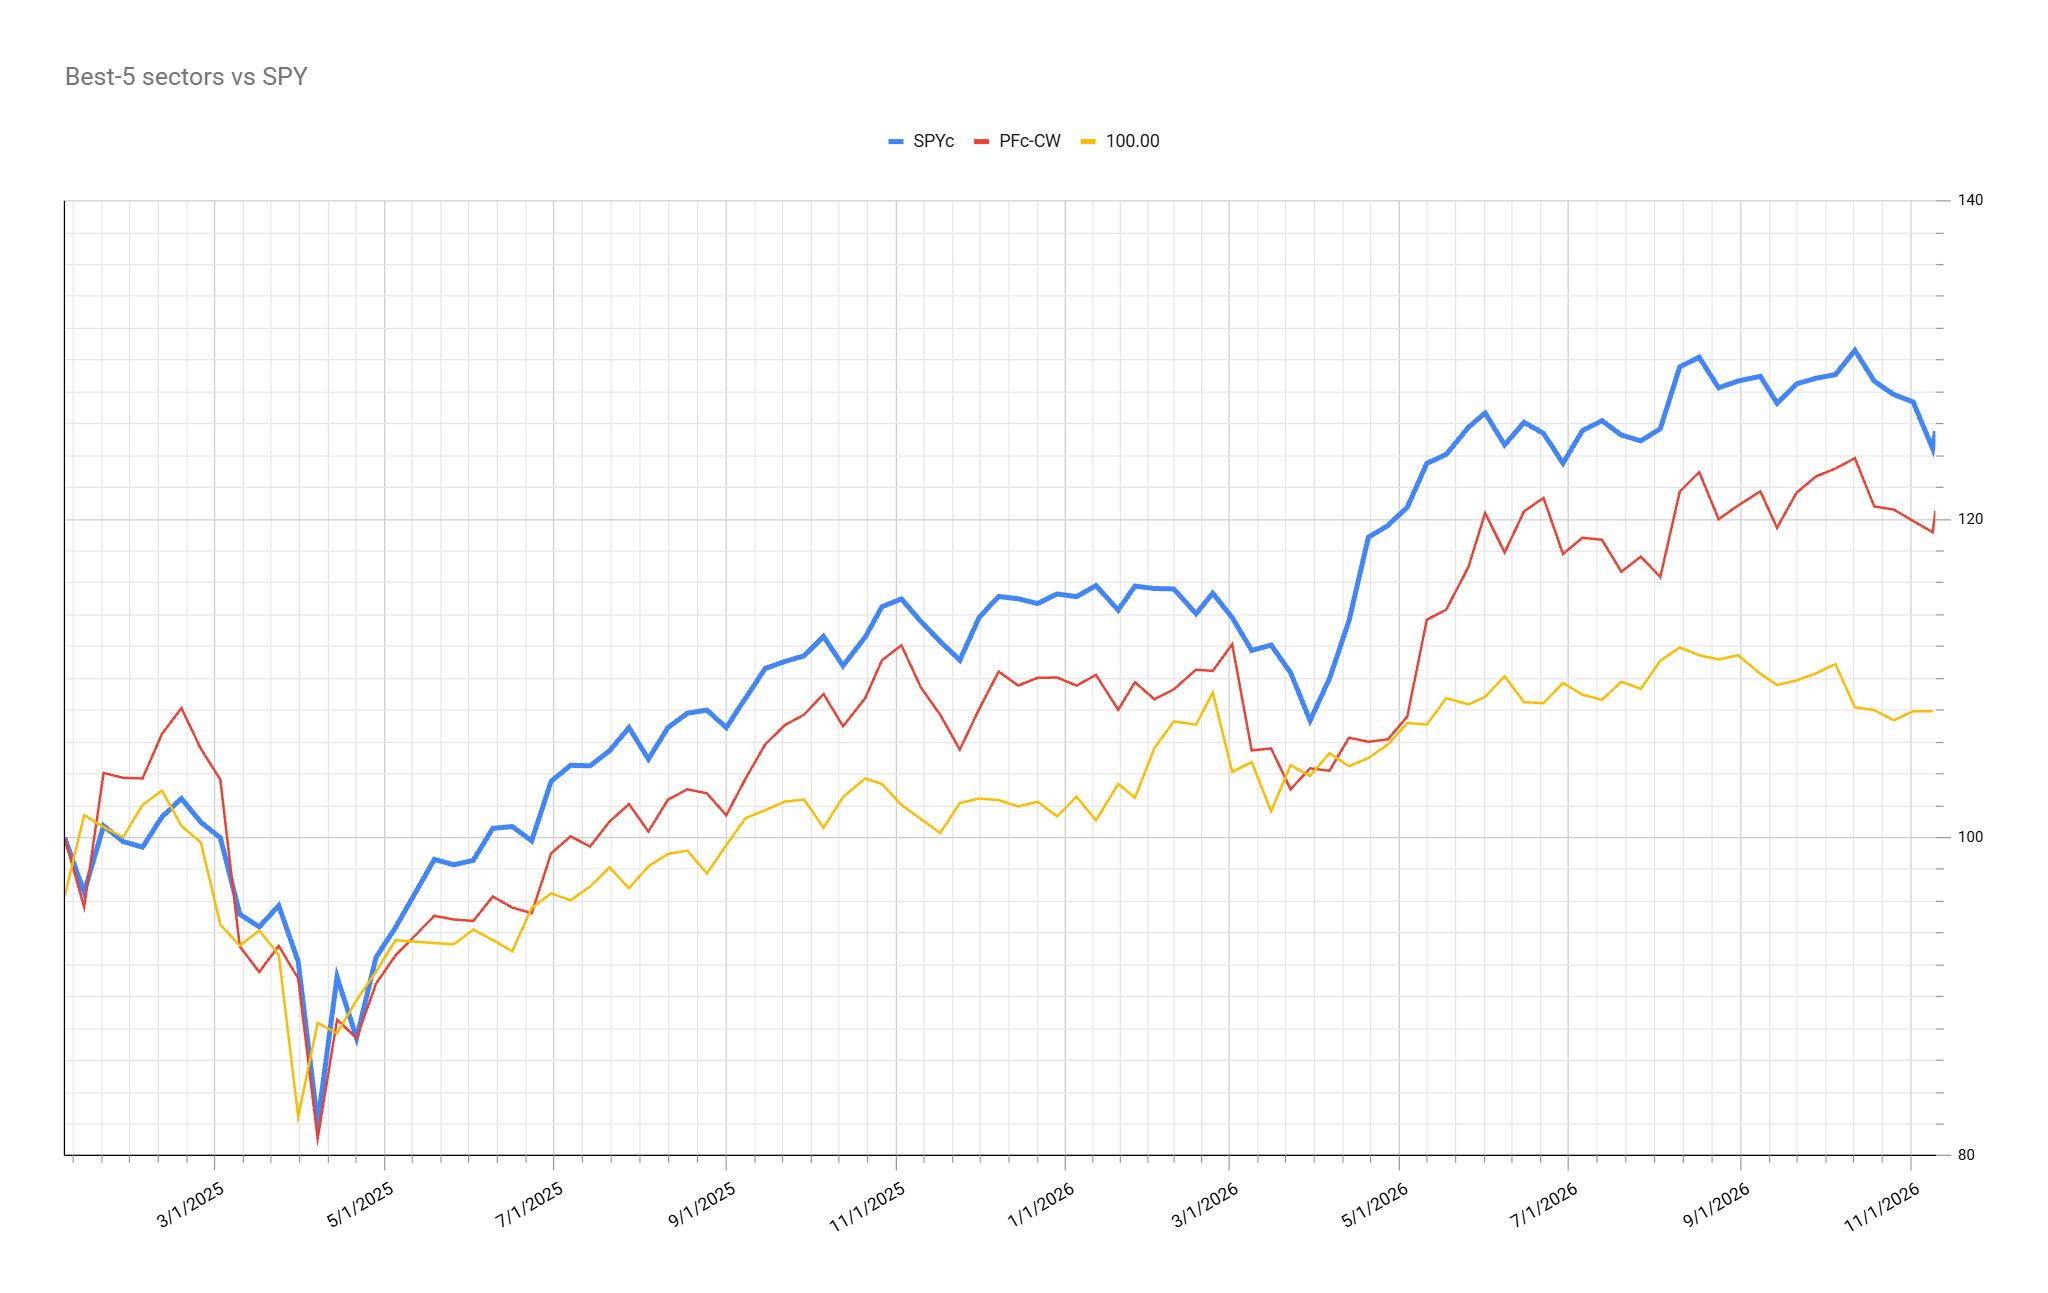
Weekly RRG for U.S. Sectors-November 9, 2026. Chart source: StockCharts.com.Daily RRG For U.S. Sectors, November 9, 2026. Chart source: StockCharts.com.Weekly Bar Chart With Relative Strength and RRG Lines: Health Care. Chart source: StockCharts.com.Weekly Bar Chart With Relative Strength and RRG Lines: Energy. Chart source: StockCharts.com.Weekly Bar Chart With Relative Strength and RRG Lines: Financials. Chart source: StockCharts.com.Weekly Bar Chart With Relative Strength and RRG Lines: Consumer Staples. Chart source: StockCharts.com.Weekly Bar Chart With Relative Strength and RRG Lines: Materials.Chart source: StockCharts.com.SPY: Weekly Bar Chart With RSI and MACD. Chart source: StockCharts.com.Portfolio Composition Overview.Performance Comparison Graph.
Julius is a CMT and the creator of Relative Rotation Graphs™. This unique method to visualize relative strength within a universe of securities first launched on Bloomberg professional services terminals in 2011 and later on StockCharts in 2014.
Learn More