Nasdaq Hits New Highs: Is the Rally Broad Enough?

Key Takeaways
- Nasdaq remains strong, with semiconductors and AI-related stocks driving the stock market higher.
- Regional banks, homebuilders, retail, and transportation stocks continue to lag.
- Keep an eye on Treasury yields for inflation clues.
The Nasdaq Composite ($COMPQ) closed at an all-time high for the second straight day, while the S&P 500 ($SPX) is within striking distance of its closing high. At the same time, the Cboe Volatility Index ($VIX) is around 14, signalling relatively calm market conditions. This isn’t the type of price action you may have expected in the second half of September, especially during a midterm year.
After several weeks of rangebound movement, the stock market suddenly made a strong push higher. This suggests that the market is anxious to reach new highs, which makes the recent price action worth a closer look.
Breaking Down the Stock Market, Technically
Let’s take a stroll through the Market Summary page after Tuesday’s close.
To start, we'll look at the Equities panel and sort the +/- SMA (200) column. The Dow Transports and Dow Utilities are the only two major U.S. indexes trading below their 200-day simple moving averages (SMAs). The Nasdaq 100 ($NDX) and Nasdaq Composite are in the lead, which isn’t surprising given that AI-related stocks are once again taking center stage.
If you scroll down to the US Industries panel, you’ll see that out of the bellwether industries, semiconductors have a StockCharts Technical Rank (SCTR) score of 98.3. You can’t say the same for regional banks, transportation, retail, and home builders.
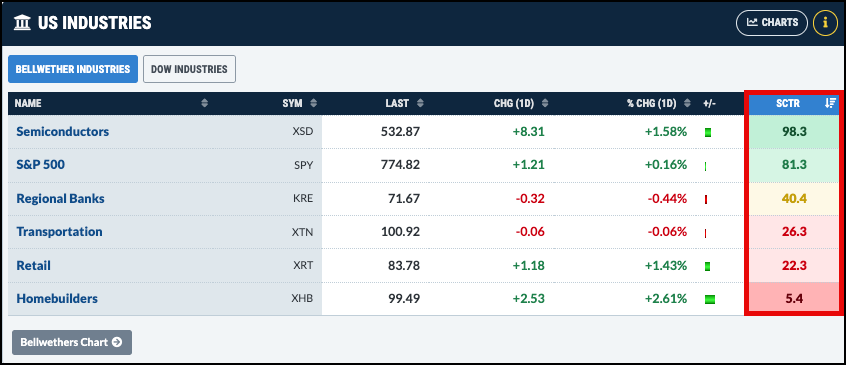
This suggests that market leadership is concentrated in technology stocks, especially those related to AI.
Muse, Meta’s AI assistant, has been making waves and was the most downloaded app on Apple’s App Store. This points to growing demand for AI-powered personal assistants that can help with shopping, booking travel, paying bills, and handling everyday tasks. As AI usage grows, so does the need for computing power. And more computing power means more demand for semiconductors.
The VanEck Semiconductor ETF (SMH) has been in a downtrend since June 22. On July 15, the 21-day exponential moving average (EMA) crossed below the 50-day SMA. A few days before the crossover, the Percentage Price Oscillator (PPO) crossed into negative territory, signaling that momentum was weakening. Even after recovering from the late July low, the 21-day EMA remained below the 50-day SMA.
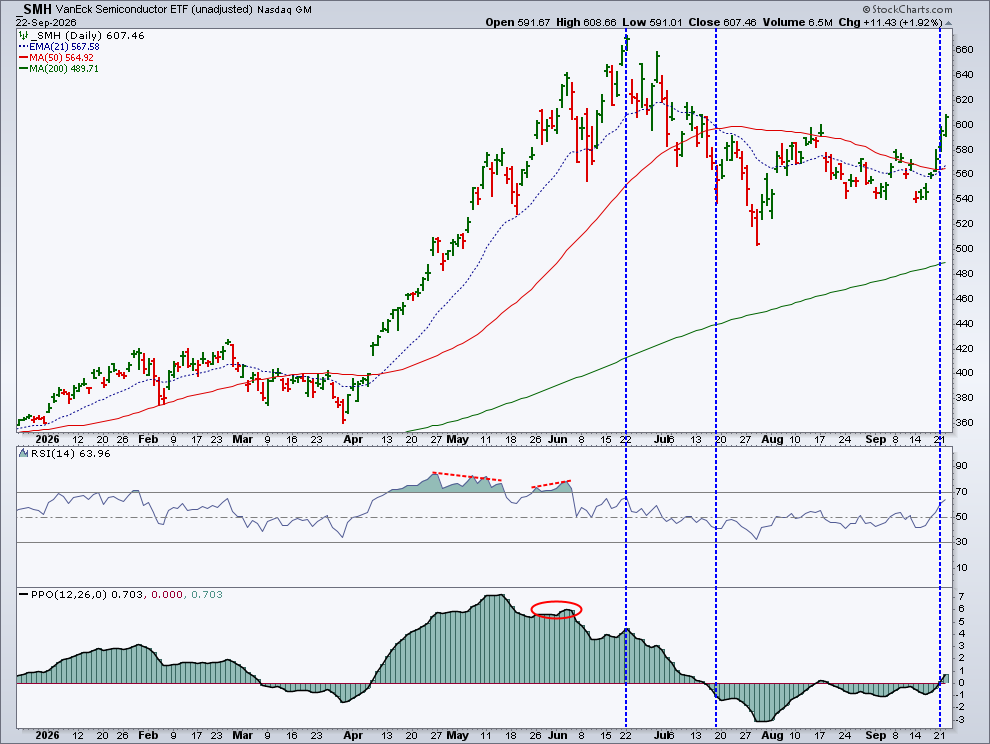
Recent concerns surrounding AI safety and security didn’t help sentiment. But that has changed. Over the last three days, SMH made significant upside moves, with the 21-day EMA having crossed above the 50-day SMA and the PPO having moved into positive territory. The Relative Strength Index (RSI) is also approaching the 70 level. A move above 70 would add further evidence that bullish momentum is strengthening.
AI-related stocks started moving higher after Treasury Secretary Scott Bessent spoke with the Chinese Vice Premier about establishing AI safety mechanisms. This is another reason for increased semiconductor demand.
So, yes, the move in semiconductor stocks has been headline-driven. If the technical picture continues to strengthen, this asset group could have more room to run.
Oil Pulls Back
Crude oil has also made a headline-driven move to the downside. President Trump said he was open to meeting with the Iranian president at the UN General Assembly, which helped push oil prices lower. Light Crude Oil ($WTIC) is now trading just below $90 per barrel.
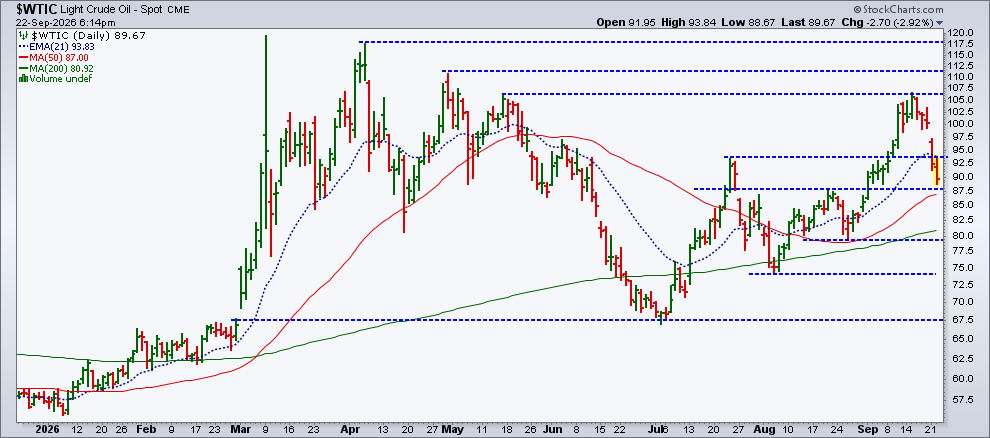
WTIC has pulled back towards its 50-day SMA, which is close to the $87.60 level, the August high. That will be a key area to watch.
Lower oil prices helped ease some inflation concerns, and Treasury yields pulled back slightly. They still remain elevated, though, with the 10-Year U.S. Treasury Yield Index ($TNX) at 4.97%.
Precious metals are also starting to show signs of life. One chart I especially like is the iShares Silver Trust (SLV). The ETF has bounced off its 21-day EMA, the RSI is above 50 and trending higher, and the PPO has just crossed into positive territory.
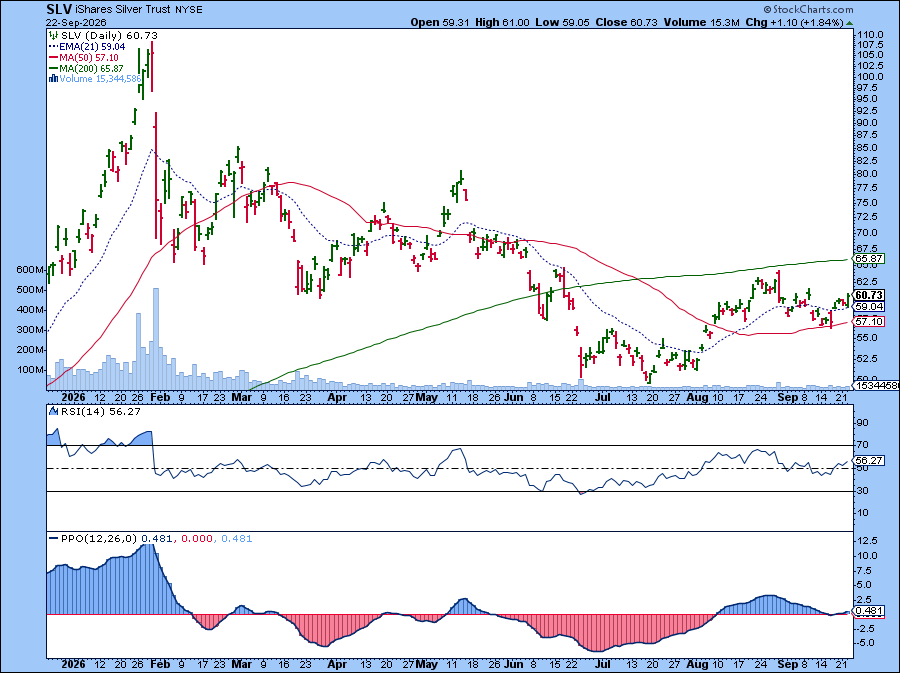
A move higher accompanied by stronger volume would make this setup interesting from the long side.
Where are the Cracks?
Let’s return to the US Industries panel on the Market Summary page. Regional banks, homebuilders, retail, and transportation are showing signs of weakness.
Transportation stocks may be feeling the effects of high diesel prices. Banks, homebuilders, and retail, meanwhile, are likely facing pressure from higher yields. Monitoring these weaker industry groups can provide an indication of whether the market’s breadth is broadening or concentrated in technology stocks.
If yields remain high, and especially if the Fed raises rates again at its next FOMC meeting, the pressure on consumers could show up in sentiment and spending.
Do Your Due Diligence
You can monitor consumer sentiment in the Sentiment panel on the Market Summary page. This is one reason scrolling through this page before the market opens is a valuable habit to build into your routine.
Nobody knows with certainty what the stock market will do from one day to the next. Investing is about probabilities. The more you understand the market’s trend, leadership, momentum, and areas of weakness, the better positioned you are to determine which price moves are likely to continue.
You also know that there’s always a chance that price moves against you. When the conditions that supported your reason to enter a trade are no longer valid, you need to be willing to make adjustments.
Get the full market story in one stop. Visit the Market Summary page to see what's leading, what's lagging, and what's quietly shifting beneath the surface.
Disclaimer: This blog is for educational purposes only and should not be construed as financial advice. The ideas and strategies should never be used without first assessing your own personal and financial situation, or without consulting a financial professional.