The Good, the OK, and the Bad of Mega Cap Growth

All mega-cap growth stocks are not created equal! As we started to note some breakdowns in the Magnificent 7 stocks earlier this year, I decided to designate a slightly larger group of growth stocks and ETFs as “Dave’s Dirty Dozen”. It felt like this moniker reflected the importance of monitoring this group of key growth charts, but also acknowledged the decidedly mixed results as 2026 has progressed.
Back in my days working for a large buy-side institution, I learned the value of “bucketing” stocks by their patterns. Given any list of stocks, whether it’s the members of an equity benchmark or the holdings in a client portfolio, we can apply this bucketing technique to focus our attention on the most compelling technical opportunities.
With that in mind, I took the liberty of separating these important charts into three buckets: the good charts, the OK charts, and the bad charts. For each bucket, I’ll share an example name and then describe the technical patterns that earned the stock a place in that category.
For stocks in the good bucket, what signals or patterns would tell me that the bullish move is over? For the bad charts, what signals or patterns would tell me the chart now deserves to be in a different bucket? By categorizing the charts right up front, we can ensure that our attention is on the most compelling opportunities!
The Good Bucket: NVIDIA (NVDA)
The chart of NVIDIA provides perhaps the clearest example of a chart that has earned a spot in the good bucket. The price established a new 52-week high on Friday, and remains above upward-sloping moving averages. And with that positive trend in place, the relative performance has been strong.
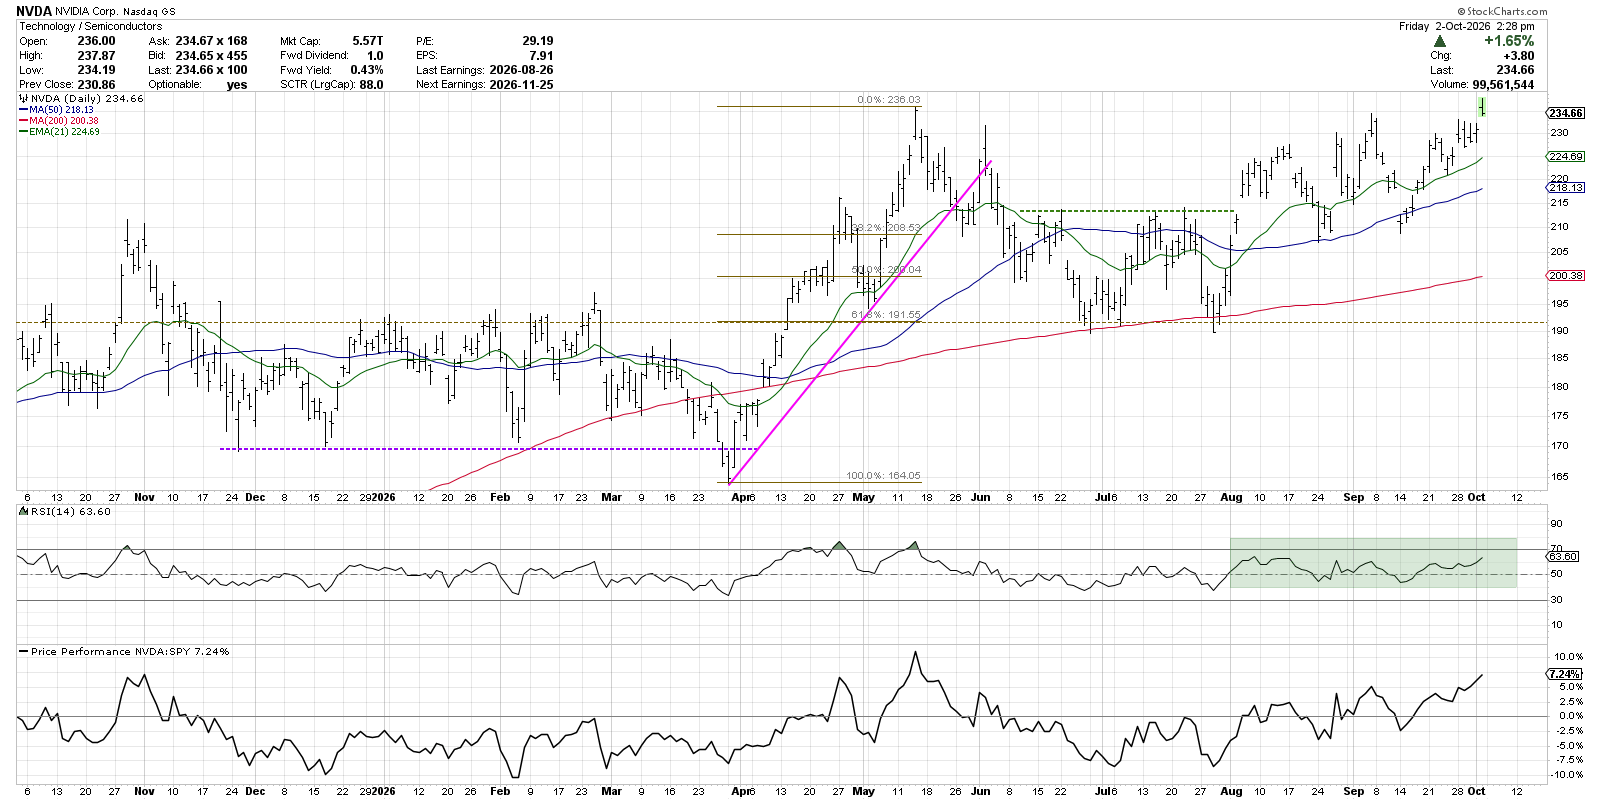
We can see how NVIDIA has been outperforming the S&P 500 since the end of June, and the improving momentum through the course of this week implies more strength to come. When the price breaks out to a new swing high, I like to see the breakout confirmed by the RSI pushing above the 60 level. While it remains to be seen whether NVDA will hold this most recent breakout, the strong trend and momentum configuration suggests strength until further notice.
The OK Bucket: Alphabet (GOOGL)
The chart of Alphabet is about as neutral as it gets. Since the end of July, we’ve observed a consolidation pattern of lower highs and higher lows, as the price rotates around an equilibrium price around $345. The momentum has also remained in a neutral range, as the RSI has bounced between 40 and 60.
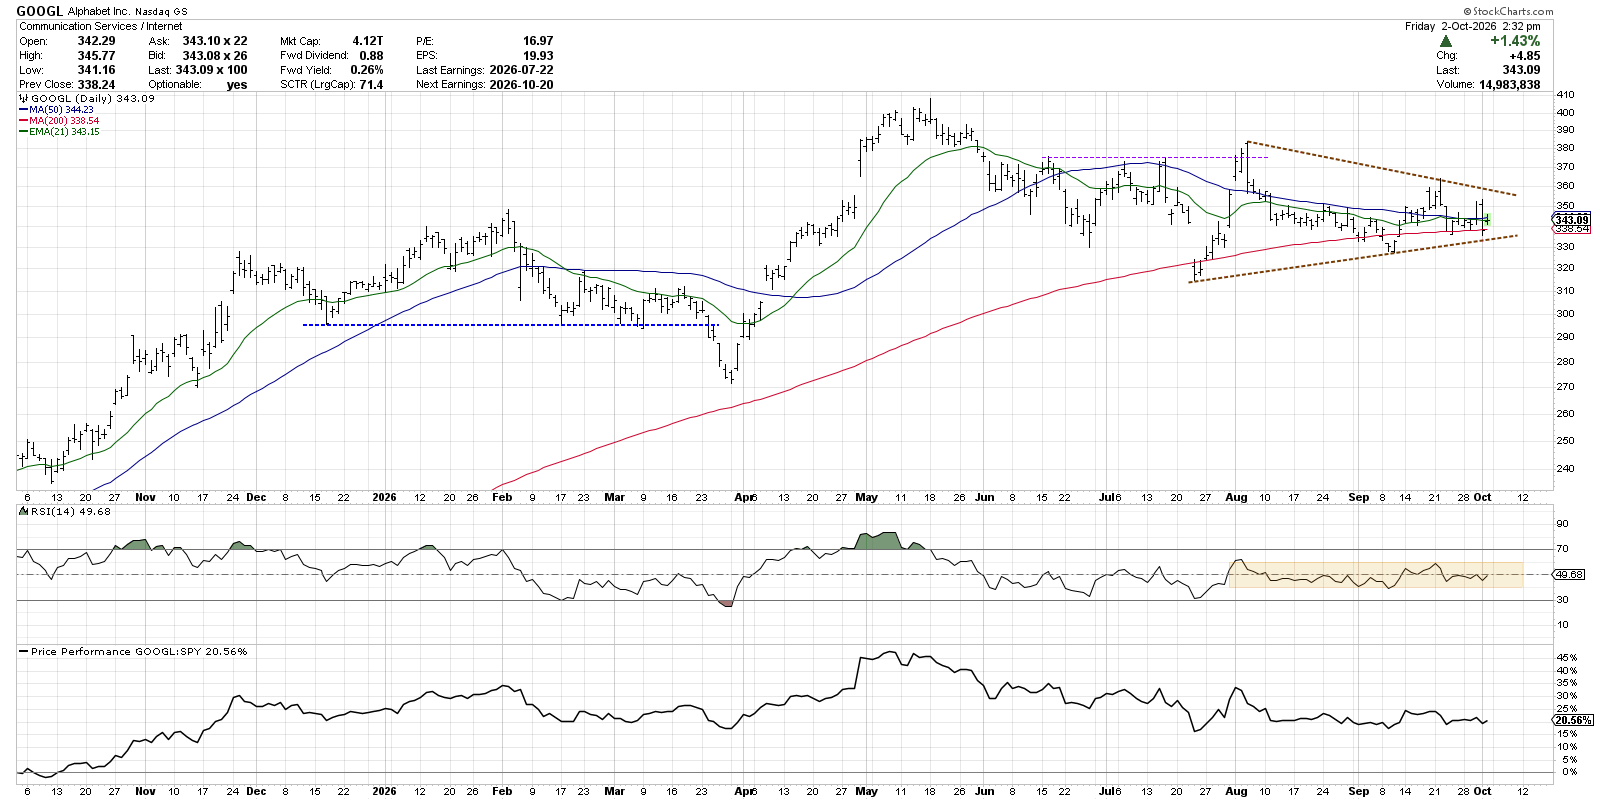
While GOOGL is indeed holding its 200-day moving average, the lack of conviction is evident with the indicators all settling into a sideways trend configuration. Until Alphabet can confirm a breakout from this coil pattern, confirmed by a strong move in momentum, this seems to be a neutral chart with no directional forces in play.
The Bad Bucket: Broadcom (AVGO)
While most of Dave’s Dirty Dozen are above the 200-day moving average, Broadcom stands out for its negative trend structure. The moving averages are sloping lower, the momentum is consistently in the bearish range, and the weak trend has led to a period of strong underperformance.
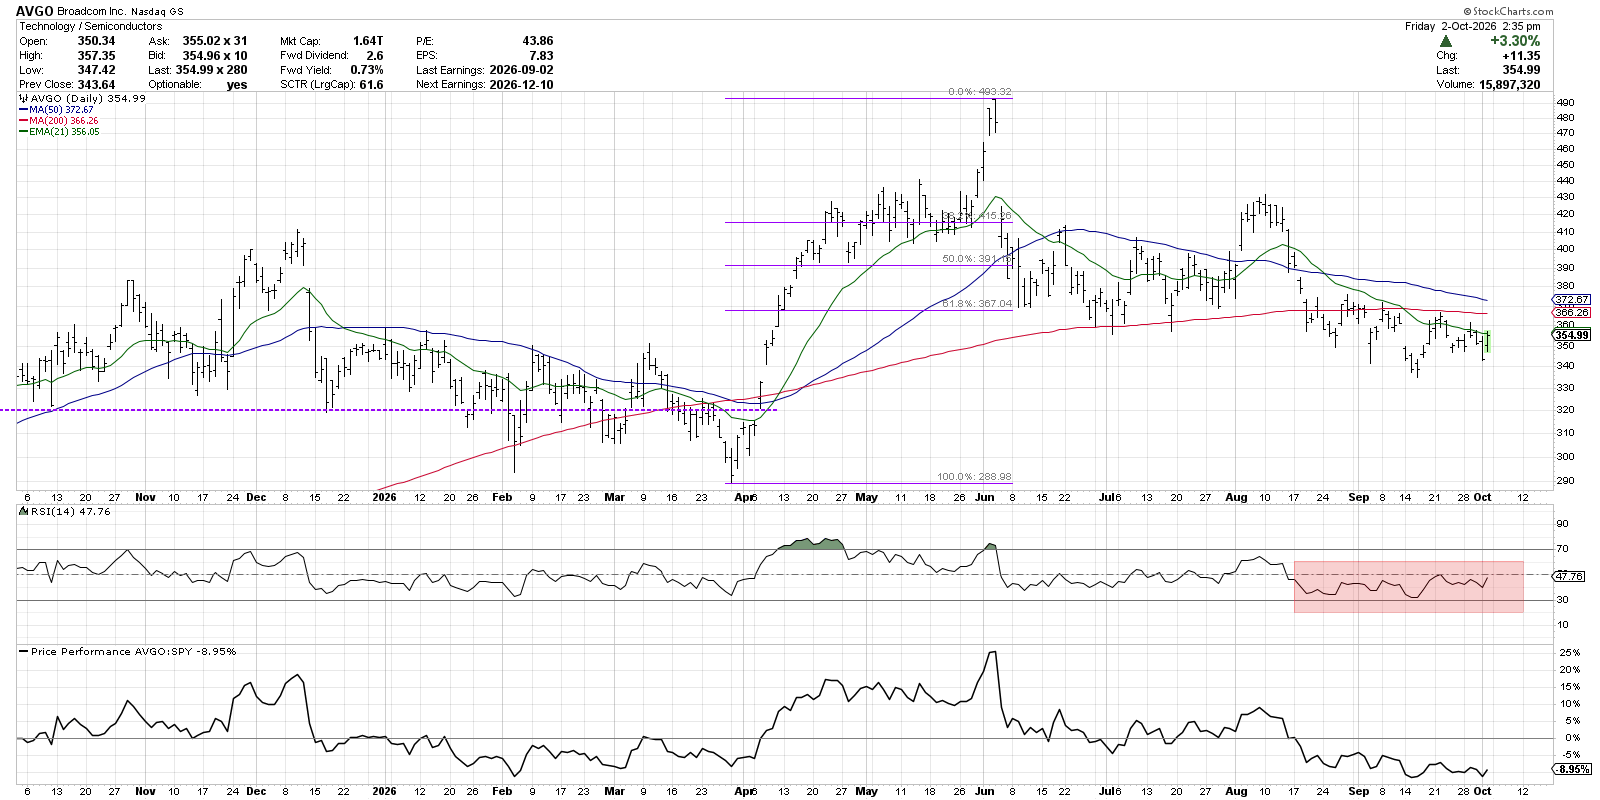
So what would make a chart like AVGO more compelling, deserving a move up to a different bucket? Quite simply, we’d need to see a change in trend with the price breaking back above key moving average support. We definitely need to see an improvement in momentum, with the RSI pushing above the 60 level.
Two things to remember about names that end up in the “bad” bucket. Once we’ve established that the name is one with bearish technical patterns, we can focus our attention on more actionable setups. But, we can also define clear signals and levels to watch, and set up technical alerts to make sure we don’t miss that one move that could signal a fantastic opportunity!
RR#6,
Dave
P.S. Ready to upgrade your investment process? Check out my free behavioral investing course!
David Keller, CMT
President and Chief Strategist
Sierra Alpha Research LLC
marketmisbehavior.com
https://www.youtube.com/@DKellerCMT
Disclaimer: This blog is for educational purposes only and should not be construed as financial advice. The ideas and strategies should never be used without first assessing your own personal and financial situation, or without consulting a financial professional.
The author does not have a position in mentioned securities at the time of publication. Any opinions expressed herein are solely those of the author and do not in any way represent the views or opinions of any other person or entity.