Week Ahead: NIFTY Stays In A Range; Moving Past This Level Important For A Directional Move

The markets traded in a range-bound manner through the week, ending with a modest loss as the Nifty struggled to build on its recent rebound. After oscillating within a band, the index traded in a 725.70-point range, marking a weekly high at 24,530.90 and a low at 23,805.20 before settling at 24,206.90. India VIX edged higher by 3.81% to 12.25, indicating a mild rise in volatility expectations despite the absence of any significant directional move. The Nifty finally closed the week with a minor loss of 63.95 points (-0.26%).
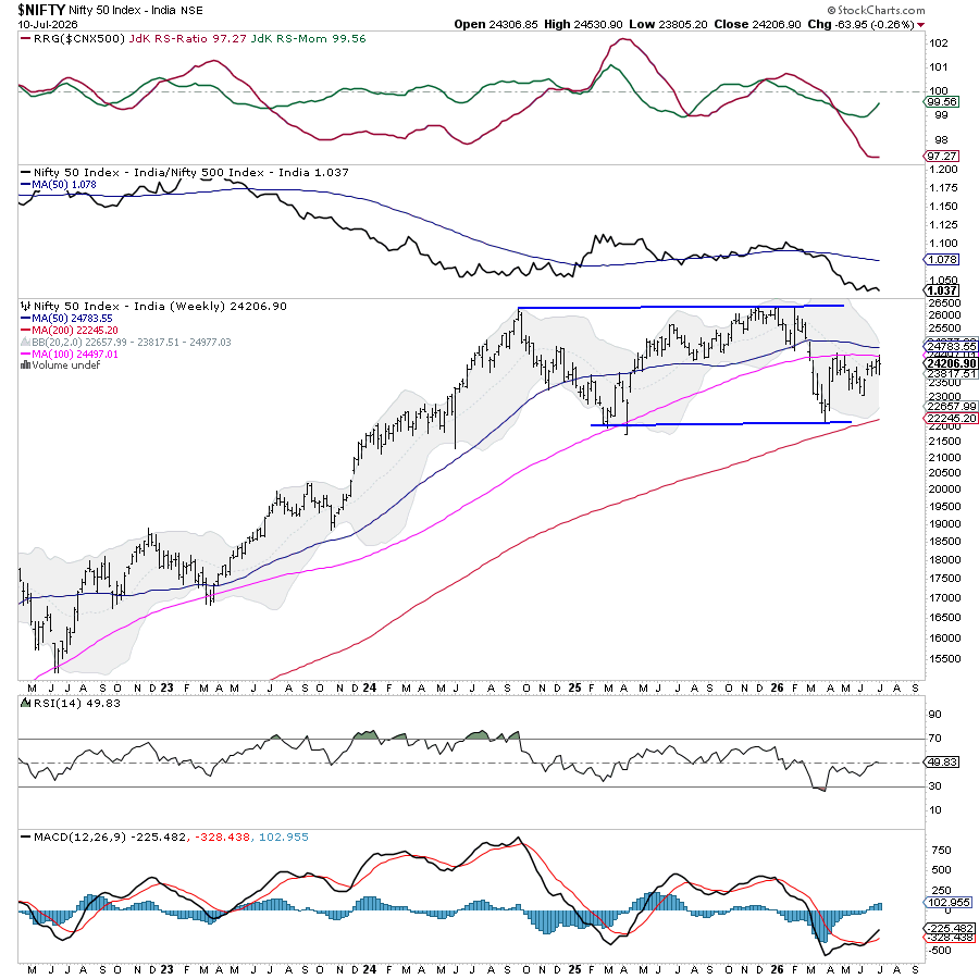
The broader technical structure remains one of consolidation, with the index continuing to negotiate a crucial resistance zone. Nifty once again failed to sustain above the 100-week moving average, currently placed at 24,498, underlining its significance as an immediate supply area. At the same time, the 23,800-24,000 zone continues to provide meaningful support, helping the index defend its recent gains. This has resulted in a well-defined trading range where neither the bulls nor the bears have managed to establish decisive control. A sustained move above the 100-week average would improve the technical outlook and could trigger fresh buying interest, while a violation of the 23,800 level may invite renewed corrective pressure.
The markets are likely to begin the coming week on a cautious note, while remaining stock-specific unless a breakout from the prevailing range occurs. Immediate resistance levels are placed at 24,500 and 24,650, while supports come in at 24,000 and 23,800.
The weekly RSI stands at 49.83 and remains neutral without showing any divergence against price. Momentum continues to be balanced, and the weekly MACD is still above its signal line. The latest candle reflects indecisiveness and reinforces the ongoing consolidation that generally precedes the beginning of a new directional move.
Pattern analysis suggests that the Nifty continues to remain trapped within a broader consolidation structure. While the index has successfully defended the long-term support area, it has repeatedly encountered supply around the 100-week moving average, keeping the recovery tentative. The 50-week moving average at 24,783 also coincides with the upper end of the immediate resistance zone, making the 24,500-24,800 region technically important. Unless this overhead hurdle is decisively overcome, the index is likely to remain range-bound with intermittent bouts of volatility.
For the coming week, traders should continue adopting a selective and stock-specific approach rather than chasing index moves aggressively. With the Nifty caught between a well-defined support band and a strong long-term moving average resistance, it would be prudent to wait for a decisive breakout before increasing directional exposure. Until then, maintaining disciplined risk management, protecting existing gains, and focusing on stocks displaying relative strength will remain the most effective strategy.
Sector Analysis for the Coming Week
In our look at Relative Rotation Graphs®, we compared various sectors against the CNX500 (NIFTY 500 Index), representing over 95% of the free-float market cap of all the listed stocks.
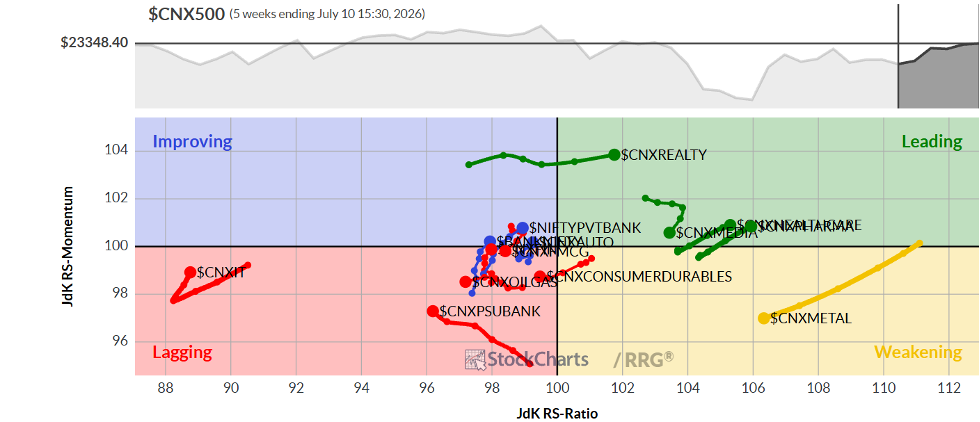
The Relative Rotation Graph (RRG) shows that the Nifty Pharma, Midcap, Media, and Realty Sector Indices are inside the leading quadrant. These groups are likely to relatively outperform the broader Nifty 500 Index.
The Nifty Infrastructure, PSE, Metal, and Energy Sector Indices are inside the weakening quadrant. These groups may continue to show stock-specific performance but, collectively, the relative performance could keep taking a backseat.
The Nifty FMCG Index has rolled back inside the lagging quadrant. This may see the sector relatively underperforming the broader markets. The Nifty IT, PSU Bank, Services Sector, and Financial Services sector indices are also inside this quadrant. However, these groups are showing a strong improvement in their relative momentum against the broader markets.
The Nifty Auto and BankNifty have entered the improving quadrant; this indicates that their phase of relative outperformance has begun. These are the only two sectors that are presently inside the improving quadrant.
Important Note: RRG™ charts show the relative strength and momentum of a group of stocks. In the above chart, they show relative performance against the NIFTY500 Index (Broader Markets) and should not be used directly as buy or sell signals.
Milan Vaishnav, CMT, MSTA
Consulting Technical Analyst
www.EquityResearch.asia | www.ChartWizard.ae