Week Ahead: NIFTY Set to See Weak Start; Watch Price Action Against This Zone

The market traded with a negative bias through the week and ended lower after remaining under sustained pressure. Nifty oscillated in a 582-point range, marking a high at 23,733.70 and a low at 23,151.50 before settling near the lower end of this band. Volatility remained subdued despite the corrective undertone, with India VIX declining 2.47% to 15.79 during the week. As a result, the Nifty ended the week with a loss of 181.05 points (-0.77%).
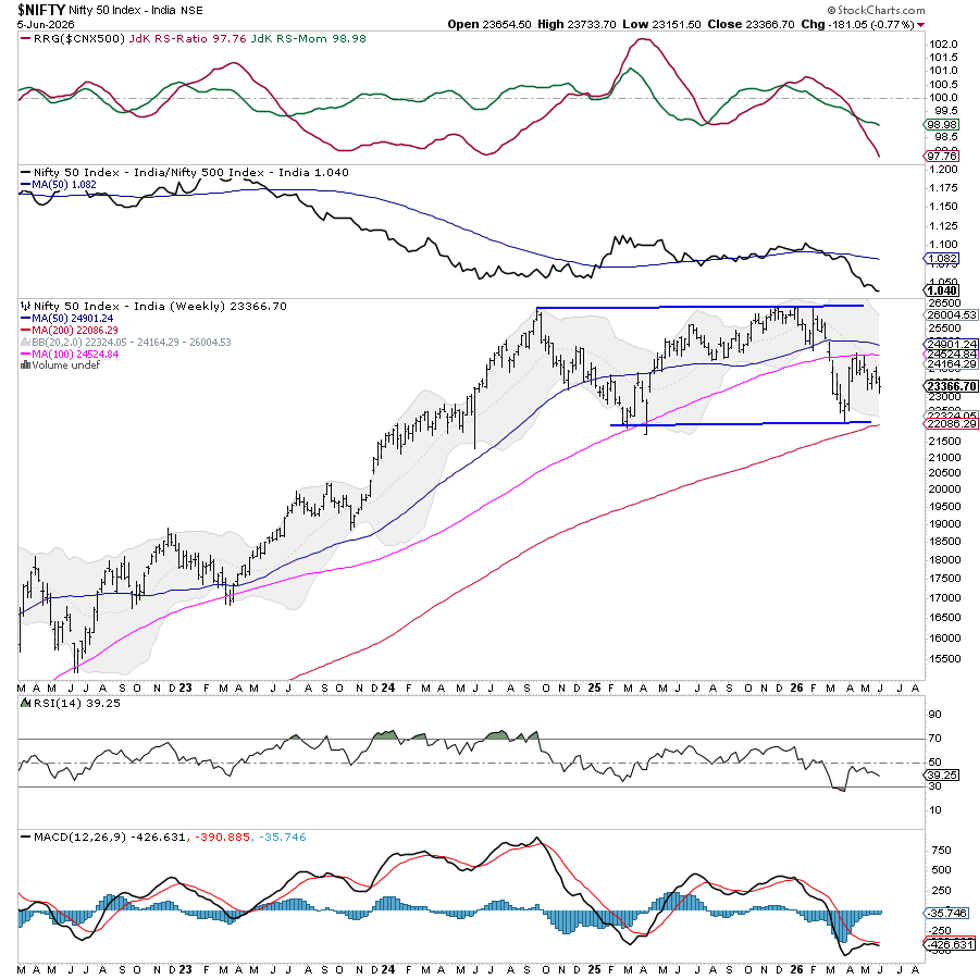
The broader technical structure is at an important inflection point. Nifty is presently trading below its 50-week and 100-week moving averages, while attempting to stabilize above a crucial support area near 23,000–23,100. This zone has emerged as a major line of defense for the market, and options data suggest that participants are likely to protect this area. While the immediate downside appears cushioned by the 23,000–23,100 zone, any meaningful and sustained violation of this support area would inflict structural damage on the market and could trigger a fresh phase of weakness. On the upside, the index must reclaim and sustain above the 23,600–23,800 zone to improve the near-term outlook and pave the way for some recovery.
The coming week is likely to begin on a cautious note, as the market continues to assess the strength of support near the lower end of the prevailing trading range. Immediate resistance levels are at 23,643 and 23,800, the former coinciding with the 20-week average. Supports come in at 23,000 and 22,800, with the 23,000–23,100 zone being the most critical area to monitor.
The weekly Relative Strength Index (RSI) stands at 39.25, below the neutral 50 mark, reflecting a weak momentum setup. The RSI shows no meaningful bullish or bearish divergence relative to price and remains neutral. Weekly Moving Average Convergence/Divergence (MACD) remains below its signal line and in negative territory.
A study of the pattern structure shows that Nifty continues to trade within a broad sideways trajectory that has governed price action over the past several quarters. The recent decline has brought the index close to the lower boundary of this formation, making the current levels technically important.
While the long-term trend remains intact as long as the channel support holds, the index remains below its 50-week moving average at 24,901 and the 100-week moving average at 24,526, keeping the medium-term trend under pressure. The 200-week moving average at 22,087 continues to provide strong long-term support, reinforcing the significance of the broader uptrend.
Given the current setup, traders should avoid adopting an overly aggressive stance until the index either decisively reclaims overhead resistance levels or confirms support-led buying from the 23,000–23,100 zone. While this support area may continue to attract buying interest, the risk-reward equation does not yet favor indiscriminate accumulation. Fresh purchases should remain highly selective and stock-specific, with greater emphasis on relative strength and risk management. Capital protection should be a priority, especially if the index shows any sustained weakness below 23,000.
Sector Analysis for the Coming Week
In our look at Relative Rotation Graphs®, we compared various sectors against the CNX500 (NIFTY 500 Index), representing over 95% of the free-float market cap of all the listed stocks.
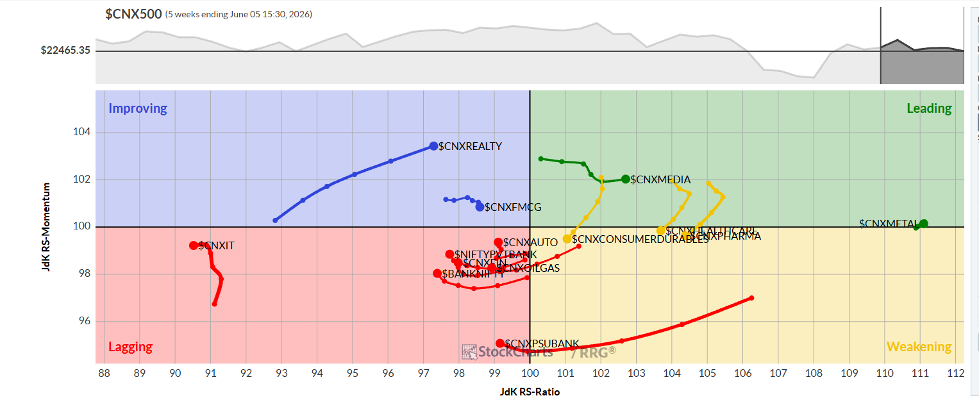
The Relative Rotation Graph (RRG) shows that the Nifty MIDCAP100, Energy, Media, and Metal Indices are the only ones inside the leading quadrant. These groups are likely to outperform the broader Nifty 500 Index.
The Nifty Pharma, PSE, and Infrastructure Indices are inside the weakening quadrant. Their relative performance is likely to slow, while isolated stock-specific performances cannot be ruled out.
The Nifty PSU Bank Index, Services Sector Index, IT, Financial Services, and Nifty Bank Index are languishing inside the lagging quadrant. These groups may relatively underperform the broader markets. The Nifty Auto Index is also inside the lagging quadrant; however, its relative momentum is improving.
While Realty and the FMCG Index remain inside the improving quadrant, the FMCG Index looks like it's giving up on its relative momentum.
Important Note: RRG™ charts show the relative strength and momentum of a group of stocks. In the above chart, they show relative performance against the NIFTY500 Index (Broader Markets) and should not be used directly as buy or sell signals.
Milan Vaishnav, CMT, MSTA
Consulting Technical Analyst
www.EquityResearch.asia | www.ChartWizard.ae