Beyond AI: The Big Breakout Happening in Transportation Stocks

Key Takeaways
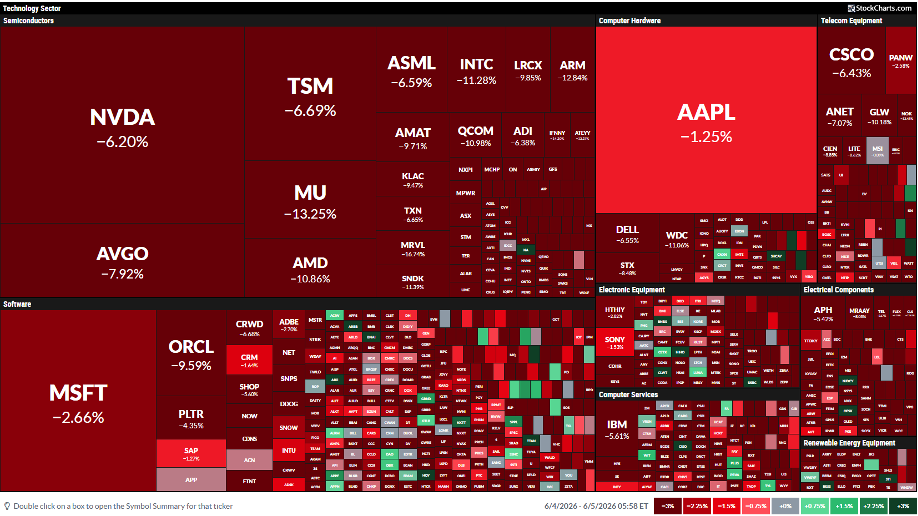
- Semiconductor companies and AI plays fell hard last week, but IYT continues making new highs.
- In a nod to old-school Dow Theory, transport stocks are quietly outperforming the broader market.
- Absolute and relative strength suggest niche-industrial leadership may broaden beyond AI winners.
Has the AI trade gotten too hot to handle? That’s the big question on Wall Street heading into the summer.
Volatility spiked into the close last week after a more-than-warm May jobs report sent Treasury yields racing. All told, the VanEck Semiconductor ETF (SMH) shed 9.2% for its worst session since January 2025, and nearly its biggest drubbing dating back to March 2020. Financial blood was spilled internationally, too, with South Korea (EWY) plunging 14% for its largest single-day decline since the COVID lows. After nearly doubling in barely more than two months, EWY entered this week a whisker from a technical bear market. Emerging Markets (EEM), now almost a high-beta AI play, also posted its worst loss in more than six years.
Three Charts Every Trader Should Bookmark
On days like last Friday, I am glued to a few StockCharts pages to assess the damage in the proper context. Before I climb aboard today’s price-action topic, I encourage traders to bookmark these three tools. They offer quick and clean snapshots of what’s going on, absent the social media noise:
- Rate of Change (ROC): Simply apply the ROC indicator to any SharpChart. On Fridays, I do it on daily and weekly charts.
- MarketCarpets: As featured in the ChartWatchers weekly newsletter, a performance heat map tells a thousand words. Check it out.
- Market Summary: This page houses tons of data. On high-volatility days, simply sort the “Equities” section by % Chg (1D) to see which groups are performing best and worst. The style box below is also useful from a factor perspective.
Check those out now.
Friday Was Ugly, But Not a Washout
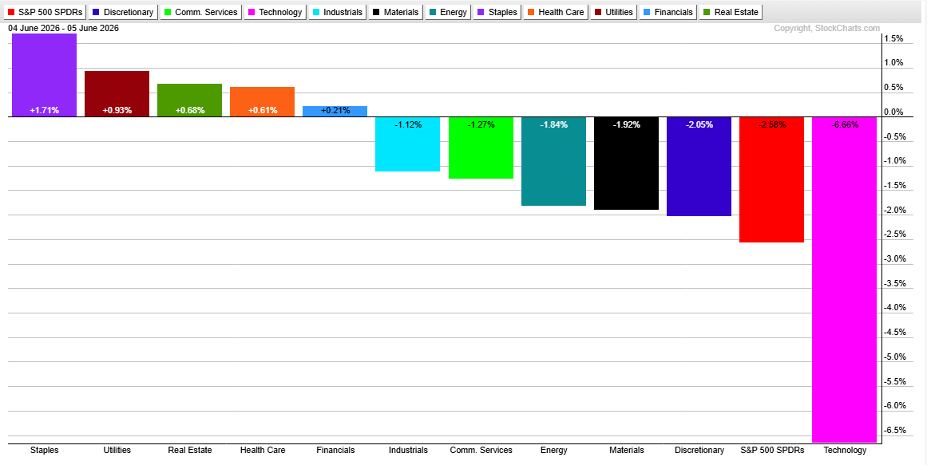
Let's turn to today’s market. while Friday was a sell-first, ask-questions-later kind of day for chips, it was by no means a washout. In fact, five of the 11 S&P 500 sectors posted gains, led by Consumer Staples (+1.7%).
Utilities, Real Estate, Health Care, and Financials were also in the green. Industrials shed 1.1%, but that was major alpha compared to the S&P 500’s largest decline in 10 months (-2.64%).
Within Industrials, transport names bucked the tape. The iShares Transportation Average ETF (IYT) settled at its best weekly mark on record. To level-set, leaders in bull markets often get taken to the woodshed now and then, and totally abandoning what has worked can be dangerous.
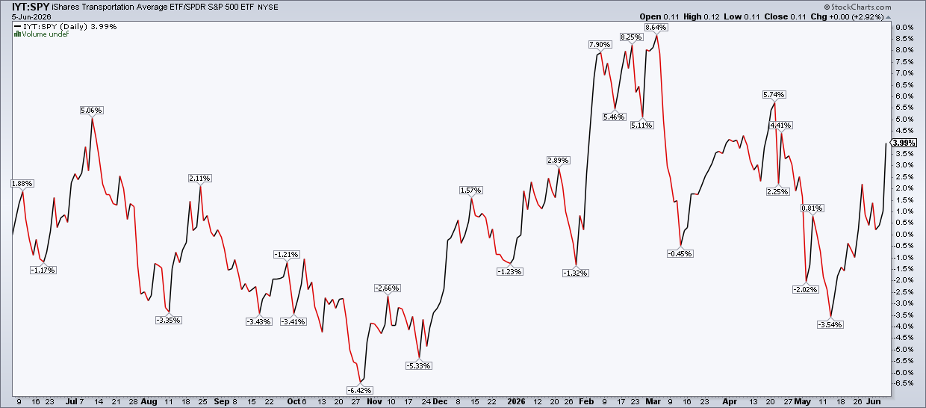
In IYT’s case, this was not a one-off rotation. The transports have steadily rallied since April 2025. What’s more, IYT has outperformed the S&P 500 ETF (SPY) by four percentage points on a total-return basis over the past year.
The Breakout Bulls Have Been Waiting For
Where might transports chug along to? Let’s make way for the chart.
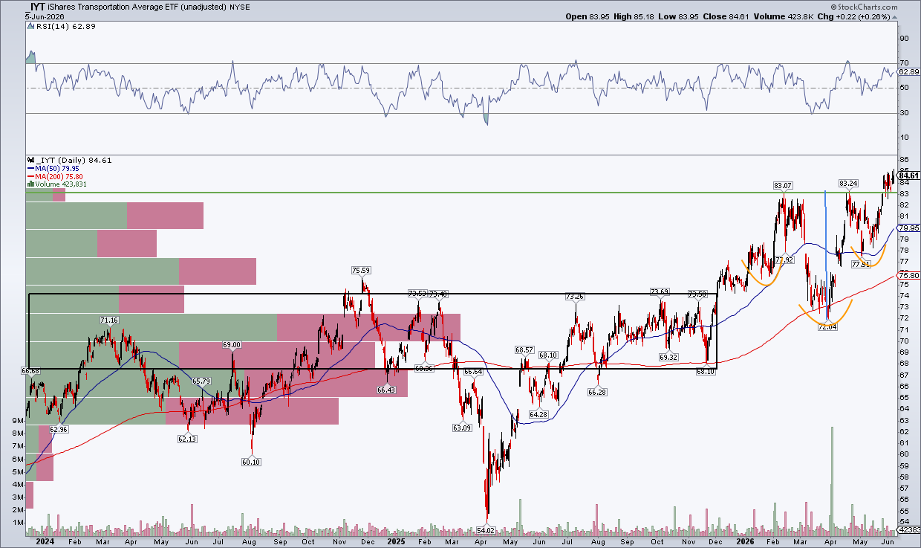
Notice in the SharpChart below that shares are breaking above a bullish cup-with-handle formation. It also has the look of an inverse head-and-shoulders pattern. Call it what you will, but the technical conclusion is the same: more upside. The measured-move price objective is $95, based on the depth of the pattern ($11+), added to the breakout point ($83–$84).
Also, look at the long-term 200-day moving average. It’s on the rise, suggesting that the bulls control the primary trend. The 50-day moving average is above the 200-day moving average, with price above both trend-indicator lines, helping to confirm a bullish bias.
The RSI momentum oscillator at the top of the chart, meanwhile, is not overbought following a tag of technical oversold conditions at the March 30 low. Back then, IYT kissed the 200-day moving average before bouncing, just as it did in November 2025.
Blue Skies Above, Clear Roads Ahead
Zoom out and we find long-term support in the mid-$70s. That was a high-congestion zone, as measured by the volume-by-price profile on the left side of the chart. Now, with blue skies above, IYT appears poised to lift off further.
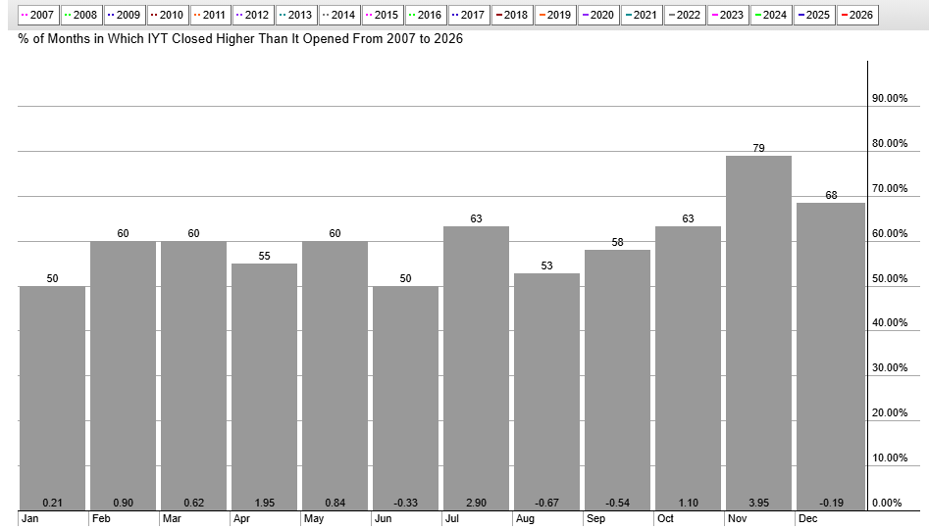
Seasonally, transports get a yellow light. June has tended to be a soft month, followed by large gains in July, before rockier August–September trends.
Trucking Is Quietly Leading the Market
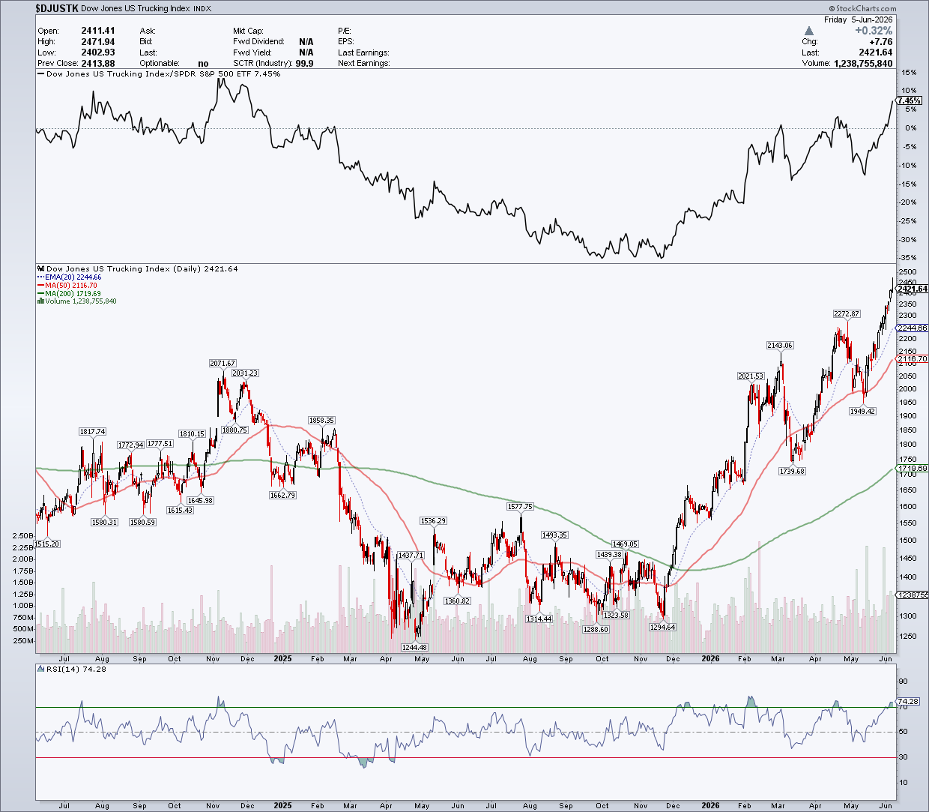
But maybe you want to get more granular. Let’s go back to the Market Summary page. Scroll down to U.S. Industries, select Dow Industries, and sort by SCTR. The top-ranking corner of the domestic equity arena is Trucking. The Dow Jones U.S. Trucking Index ($DJUSTK) rides a smooth uptrend and was up in nine of the 10 trading days entering this week.
$DJUSTK's RSI ranges in a bullish zone from 40 to 80, with price notching a record high on what was an awful tape on June 5. The pre-filled chart includes a relative strength line up top, and the industry has been in sixth gear since last November, leading the S&P 500 by several truck lengths.
Follow Prices, Not Narratives
That’s the kind of digging you can do when dramatic macro headlines come in fast and furious. Price action always offers more opportunities than reacting to the narrative of the day.
For now, I’m watching transports not just for a potential market rotation and broadening-out trend, but also for their absolute and relative strength, regardless of AI pops and drops.
The Bottom Line
Blue chips showed some muster last Friday amid the semiconductor and Nasdaq 100 selloff. Defensive sectors like Utilities and Health Care were strong, but so too were some cyclical industries. This could be the summer of trucking, rails, and airlines.
Disclaimer: This blog is for educational purposes only and should not be construed as financial advice. The ideas and strategies should never be used without first assessing your own personal and financial situation, or without consulting a financial professional.
Your next trading insight might be hiding in plain sight. Head to the Market Summary page for a real-time snapshot of major indexes, sectors, asset classes, and more.