3 ADX Signals Every Trader Should Know
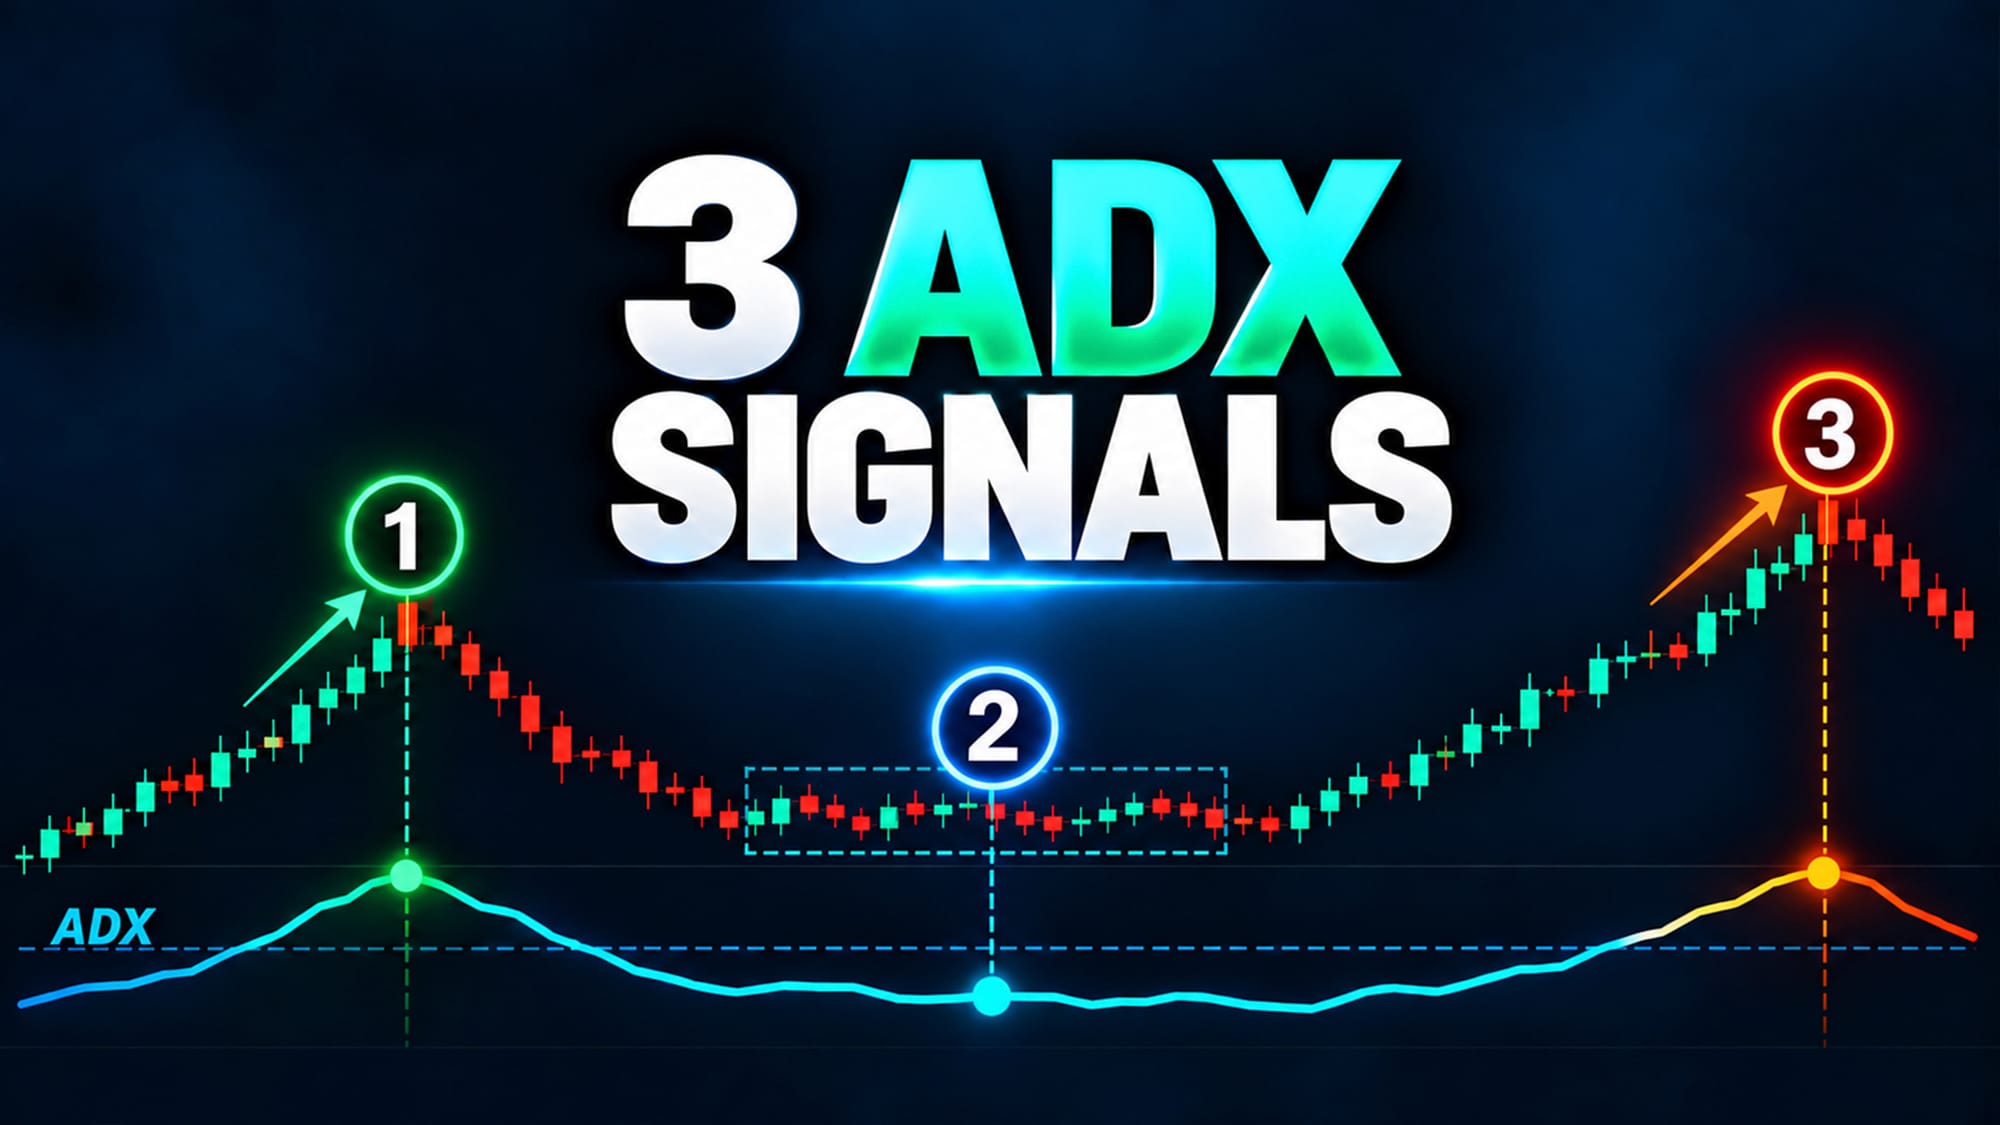
ADX can tell you whether a trend is strong or weak. The indicator can also help you spot potential breakouts, judge whether a pullback is still healthy, and recognize when a trend may be running out of steam.
In this video, Joe Rabil breaks down three practical ways to use the ADX indicator, combining ADX, DI lines, and price across multiple timeframes.
Using the 10-Year Treasury yield and JPMorgan (JPM) as examples, Joe shows how the 25 level, DI lines, trendlines, and moving averages can help distinguish a pullback from a reversal, spot low ADX breakouts, and recognize weakening confirmation as price climbs higher.
In this video you'll learn how Joe uses ADX confirmation before considering a pullback trade, what the green DI and red DI lines can reveal about buying and selling pressure, and why an extended low-ADX reading can set up a breakout opportunity. He also shows how he combines trendlines, moving averages, and ADX, and what it means when price makes a new high but ADX doesn't confirm, and how weakening ADX can help signal trend exhaustion and possible exit conditions
If ADX is part of your charting process, or if you’re not quite sure how to use it beyond the basic “trend strength” reading, this video gives you a framework you can start applying to your own charts.
This video was originally published on September 30, 2026.
Archived videos from Joe are available at this link.