This RSI Signal Could Confirm the S&P 500's Next Big Move

The S&P 500 ($SPX) is at the same level as it was the first week in August. Despite short-term upswings and downswings, and all the noise of day-to-day market action, the S&P 500 has been in a decidedly sideways trend.
One of the ways we can characterize this consolidation phase for the equity benchmark is to analyze the price momentum. Today we’ll dig into the Relative Strength Index (RSI), describe how we use “range rules” for the RSI to validate the trend, and then discuss what may come next for the S&P 500 from a momentum perspective.
Strong uptrends are validated with strong momentum
We’ll get to a current chart of the S&P 500 soon, but first let’s go back to 2025 and see what a positive trend looks like. After a major low in April 2025, the S&P 500 pushed above the 200-day moving average and then continued higher for about another eight months.
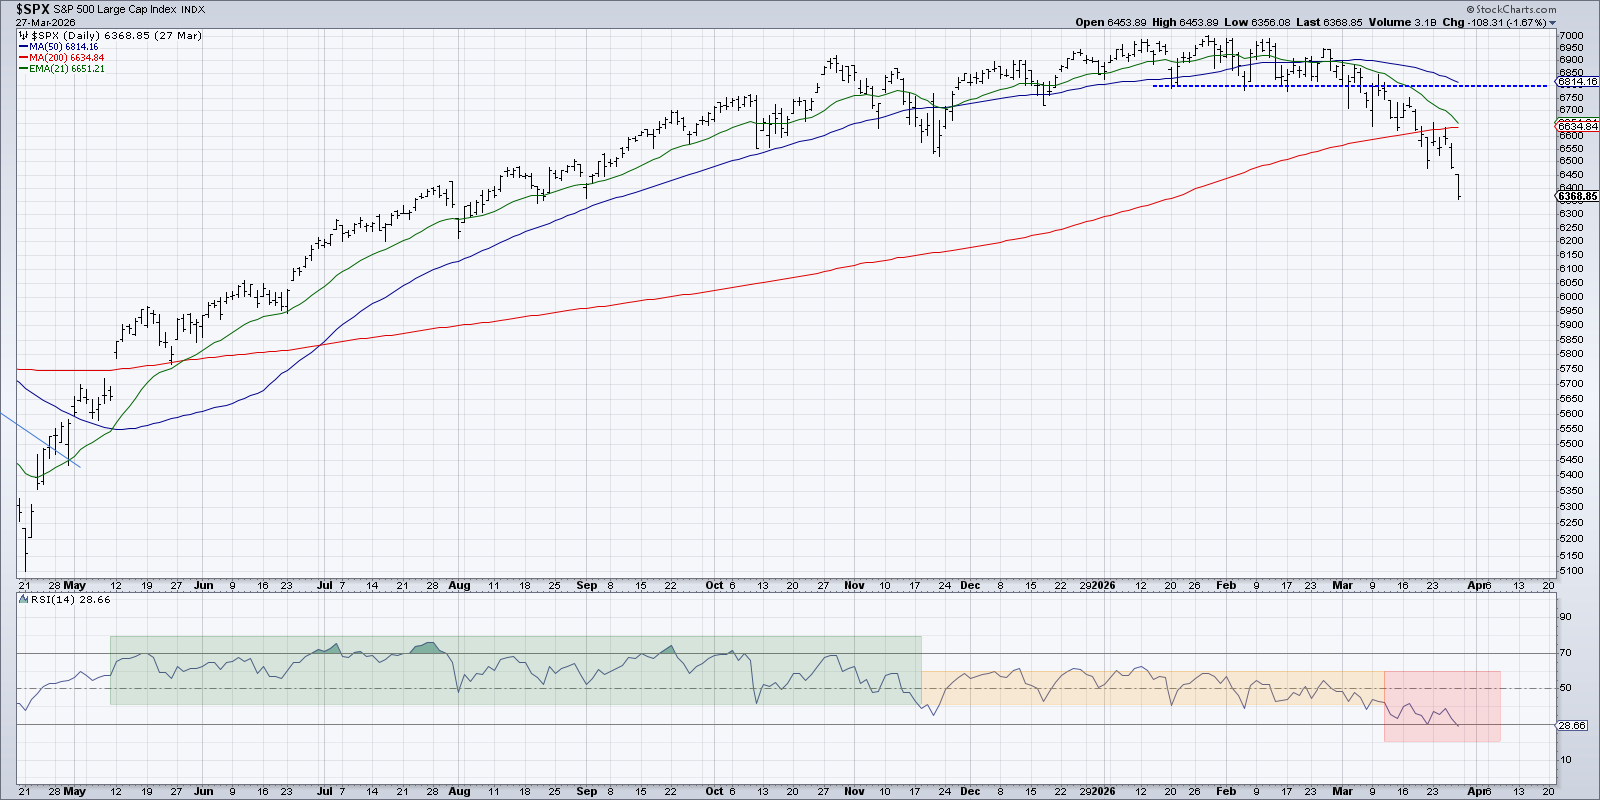
As the uptrend was confirmed through a pattern of higher highs and higher lows, the RSI remained in a bullish range. When the index made a new swing high, the RSI would often reach above 60, and the RSI would never get below 40 on pullbacks.
In an established uptrend phase, we simply need to watch to make sure the RSI remains above 40 on pullbacks. And every time it does so, that implies that there are willing dip buyers stepping in to buy on short short-term pullbacks.
A lack of upside follow through speaks to a lack of buying power
Note how the pattern shifted in November 2025, where the S&P 500 remained at or near all-time highs but the RSI never really pushed above 60. For the next four months, the RSI remained in a neutral range, stuck between 40 and 60. This confirmed a sideways trend and essentially a balance between buyers and sellers.
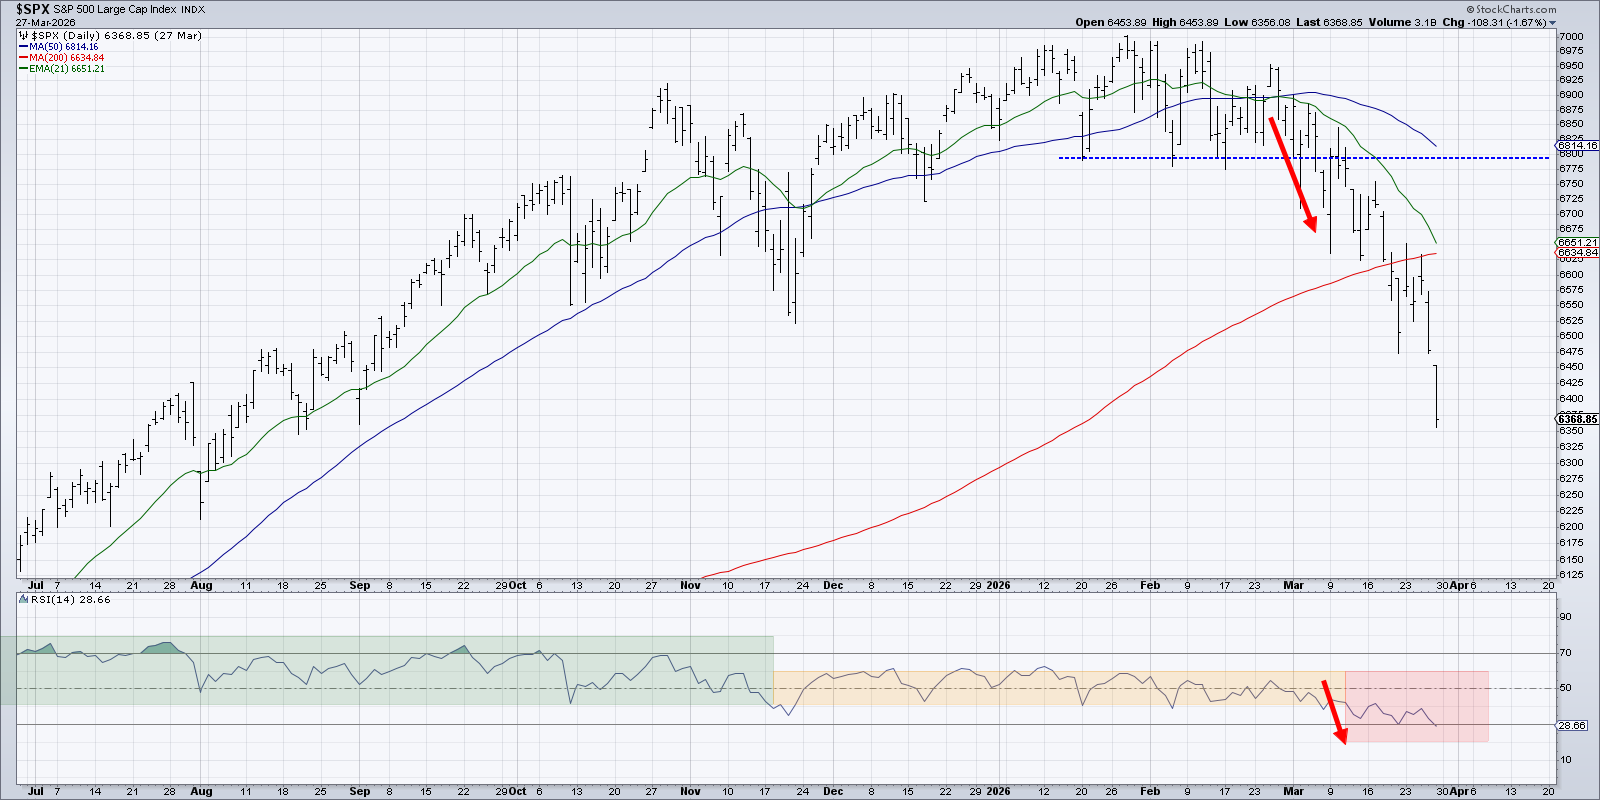
Not surprisingly, when the S&P 500 index finally broke down below clear support around 6800 in March 2026, the RSI finally pushed out of this neutral range, continuing down to oversold territory. Heavier down days spoke to a new distribution phase, and the SPX headed lower to an eventual spring low.
The S&P 500 needs to hold critical support
Now let’s consider the current S&P 500 chart, which features a neutral momentum picture very similar to what we saw in early 2026.
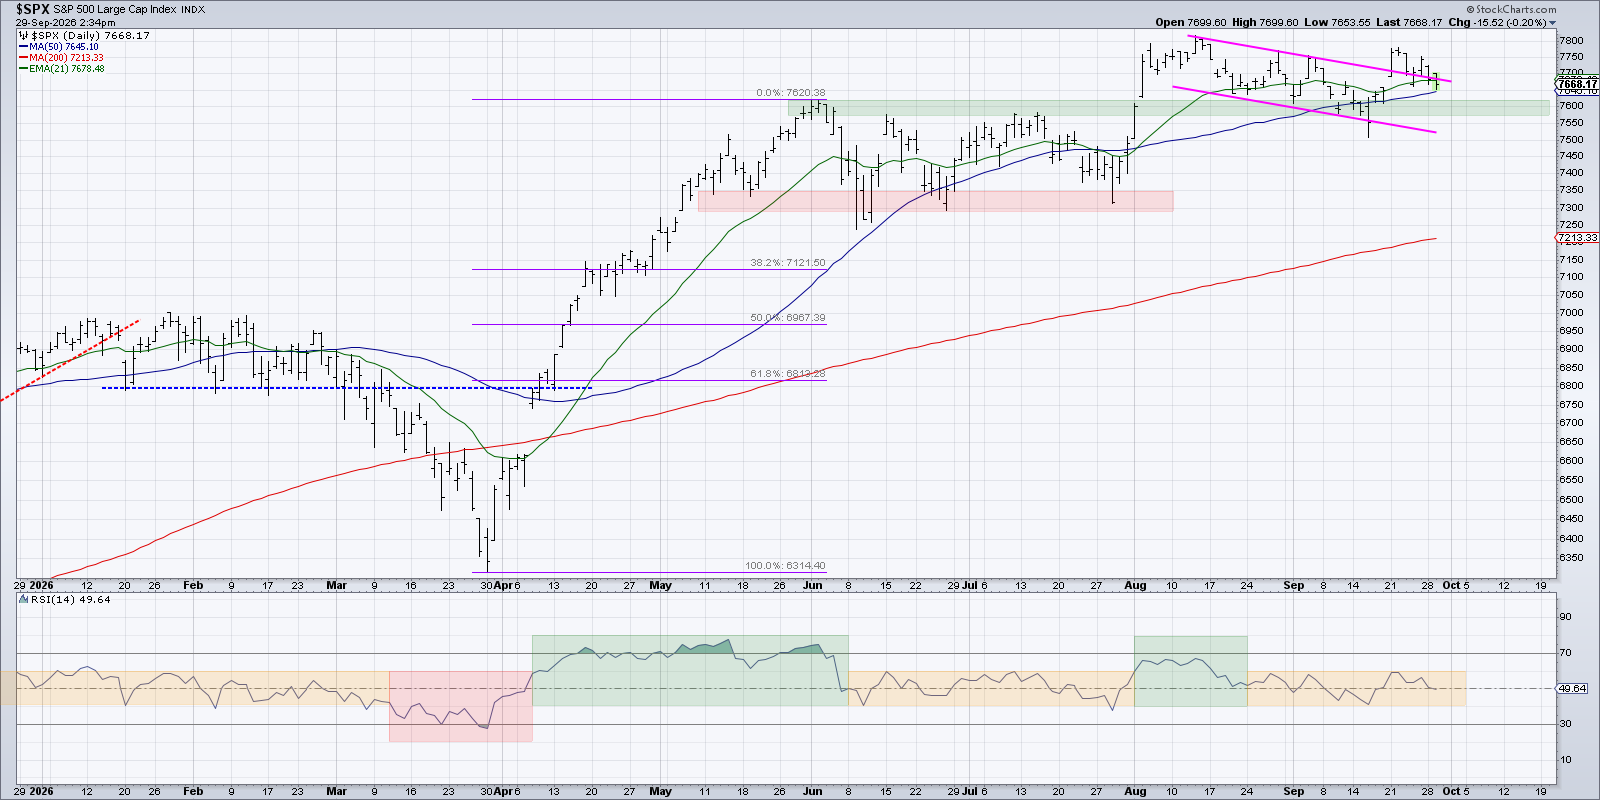
The momentum was fairly positive as the S&P 500 reached 7800 for the first time in history last month. But for the last five weeks, the RSI has stayed in that neutral range between 40 and 60. So while the major indexes have been threatening a push to new all-time highs, the momentum has indicated a lack of willing buyers and not enough upside momentum
If the S&P 500 drops going into Q4, we’ll be watching key price support around the 7600 level. But even more importantly, we’ll be focused on the RSI to see if the momentum remains neutral. Because as we’ve seen earlier this year, a breakdown of price support combined with bearish momentum readings usually results in a much more painful drawdown experience!
By the way, the inspiration for this article came from a viewer question in our Friday mailbag episode of CHART THIS with Dave Keller. Head over to our YouTube channel for other great questions and insightful answers!
RR#6,
Dave
PS.. Ready to upgrade your investment process? Check out my free behavioral investing course!
David Keller, CMT
President and Chief Strategist
Sierra Alpha Research LLC
marketmisbehavior.com
https://www.youtube.com/@DKellerCMT
Disclaimer: This blog is for educational purposes only and should not be construed as financial advice. The ideas and strategies should never be used without first assessing your own personal and financial situation, or without consulting a financial professional.
The author does not have a position in mentioned securities at the time of publication. Any opinions expressed herein are solely those of the author and do not in any way represent the views or opinions of any other person or entity.