The Bond Selloff Is Getting Ugly. Could Utilities Be the Tell?

Key Takeaways
- Treasury yields have surged, intensifying pressure on rate-sensitive S&P 500 sectors as the MOVE Index spikes.
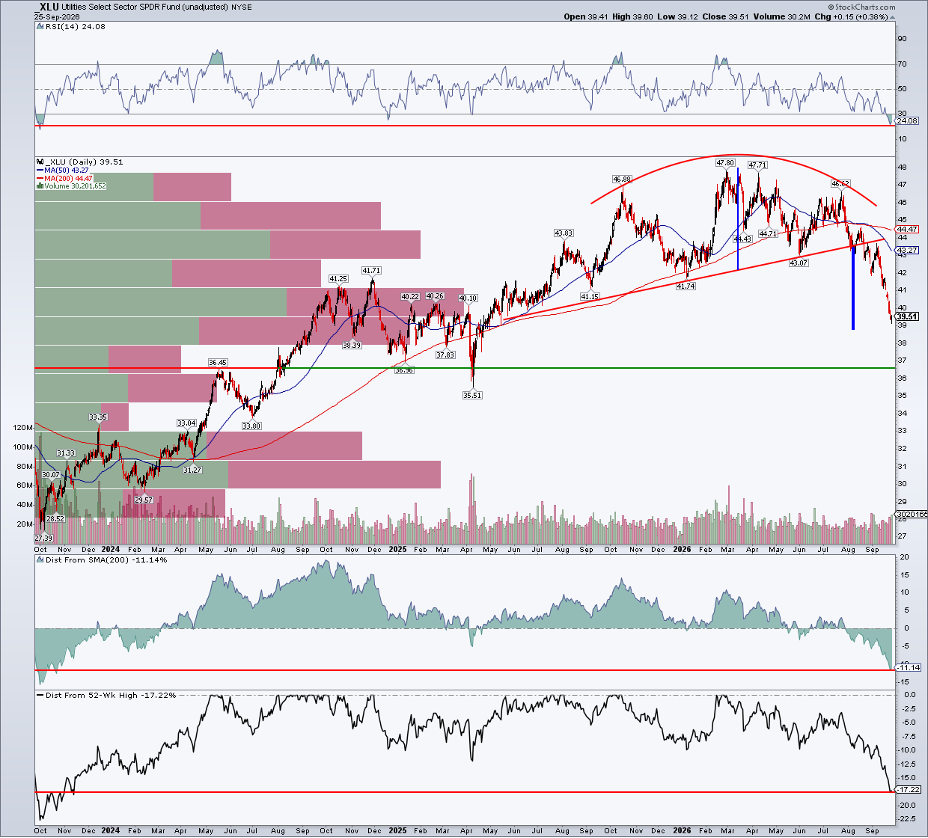
- Utilities (XLU) is deeply oversold, with shares down since February and approaching a key historical support zone.
- Interest rates and bond vol may be nearing extremes, potentially setting the stage for a short-term reversal in yields and risk assets heading into Q4.
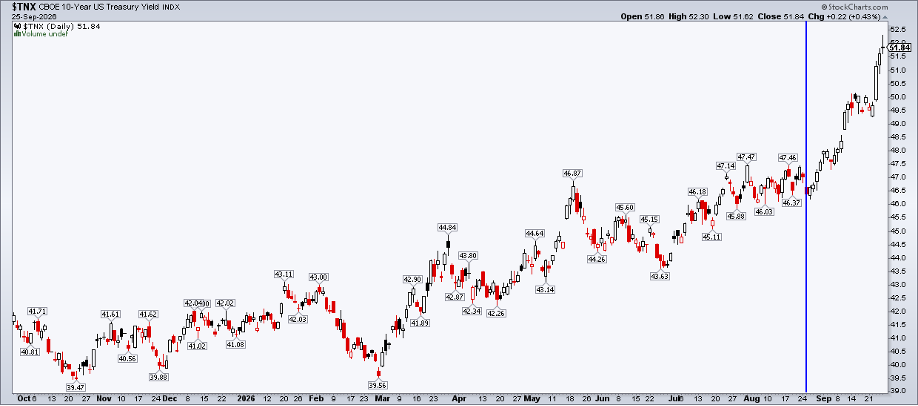
September has lived up to its bearish billing... if you’re a bond investor. The yield on the benchmark 10-year Treasury rate has surged from a 4.639% close on Tuesday, August 25, to above 5.2% as September Jobs Week kicks off on Wall Street. Indeed, the past five weeks have gone from an orderly yield ascent to a high-volatility bond bruiser.
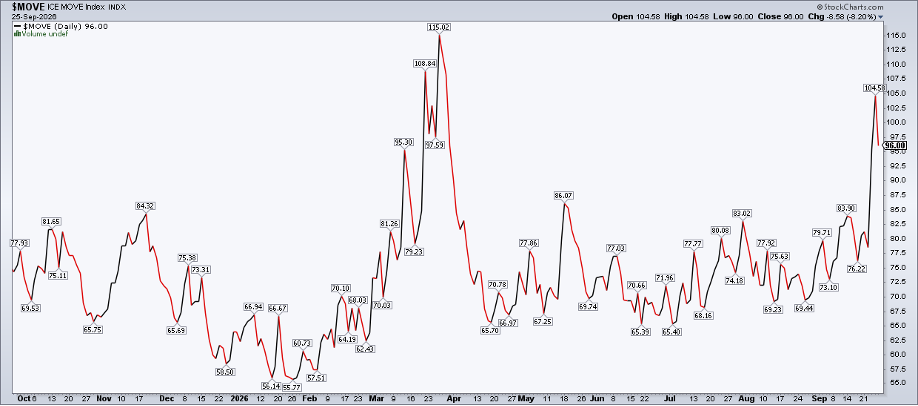
Treasurys’ fear gauge, the ICE MOVE Index ($MOVE), was near 70 in late August and may finish Q3 above 100.
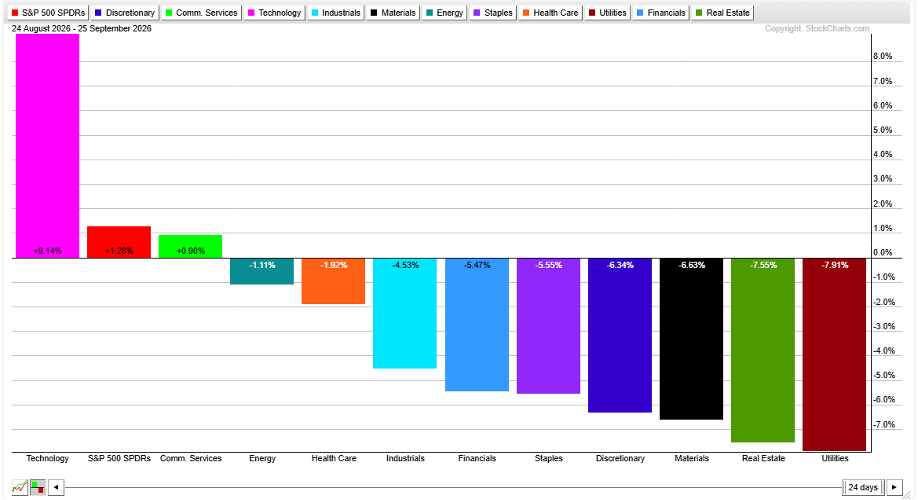
U.S. large caps (namely the Mag 7) have managed to keep it together, though. The S&P 500 ($SPX) is close to the flat line (including today’s early-week stumble), but it has been a patchwork of red beneath the surface. Some of the month-to-date sector returns and broader breadth are spooky as the leaves begin to change color. Consumer Discretionary (XLY), Real Estate (XLRE), Materials (XLB), and Utilities (XLU) are some of the roughed-up niches.
Blame the cyclical and defensive trouble on yield competition across the Treasury curve.
An October Revival?
We’ll see if the atmospherics change when the calendar flips. It’s become common knowledge on the street that we are in the heart of weak midterm-year seasonality. But bulls have historically snatched control starting on October 1, well before voters head to the polls. Much hinges on how risky assets respond to this week's jobs data.
Economists expect close to 100,000 positions added in September. That would be a barnburner of a labor market report, given that the breakeven job-creation pace needed to keep the unemployment rate steady is perhaps near 50,000. Eyes will also be on wage data, amid the broader inflation focus. A hot headline NFP number, along with firm average hourly earnings data, will almost certainly keep the bond bears in charge (and equities on their back foot).
Lights Turn Out on Utilities
Technically speaking, intermarket analysis is top of mind among active investors. A well-girded relationship today is that the faster interest rates climb, the worse breadth seems to get. Since August 25, the Information Technology sector (XLK) is the lone group outpacing the S&P 500’s 1.3% gain, while seven of the 11 sector ETFs are down by 4.5% or more. The worst? XLU. Let’s focus on the power-generation space.
Utilities is a mere 2.0% of the S&P 500. Its trailing 12-month dividend yield has shot up above 3% as shares have plunged from near $47 two months ago to under $40 currently. Is there a bounce in sight? Does XLU offer indications on the bond market’s next move? Let’s investigate.
XLU: Eyeing Downside Support
Notice in the chart below that the fund is down 17% from its late-February record level. That's a telling date, as it's almost to the moment when yields troughed ahead of the conflict in Iran. The decline is its largest since late 2023; the same goes for its distance from the 200-day moving average (11%, the widest back to October of ‘23). These are two useful indicators to measure the magnitude of a security’s drawdown.
Also look at the RSI momentum oscillator at the top of the SharpChart. It dipped into the low-20s recently, also the weakest since October 2023. Today, with both the long-term 200-DMA and the shorter-term 50-DMA falling, it's clear that the bears control the primary trend. Fundamentally, Utilities’ P/E ratio collapsed from above 18x at the start of Q3 to barely above 15x.
With most measures telling the same oversold story, support may soon be in play. The $35.50 to $36.50 range was a point of polarity in 2024 and at the April 2025 low, while a downside measured-move price objective below $39 was triggered following the break of uptrend support in August. The bearish rounded top feature portended the current plunge, along with a moving-average death cross during the summer.
The upshot? Maybe a few more percentage points of downside before buyers step up in this high-yielding sector ETF.
A Formidable Opponent
Competition from Treasury rates has simply been too much to overcome. XLU could very well reach the psychological –20% threshold. At the same time, the 30-year Treasury yield ($TYX) is essentially at its 5.55% upside measured-move target outlined in August.
It may be fuzzy in traders’ memory, but the long-bond rate fell from 5.19% in May to 4.82% by late June. A brief pause/consolidation near 5.2% in July ultimately resolved higher, and that previous 37-basis-point dip pointed to a comparably sized breakout, into the mid-5.50% area.
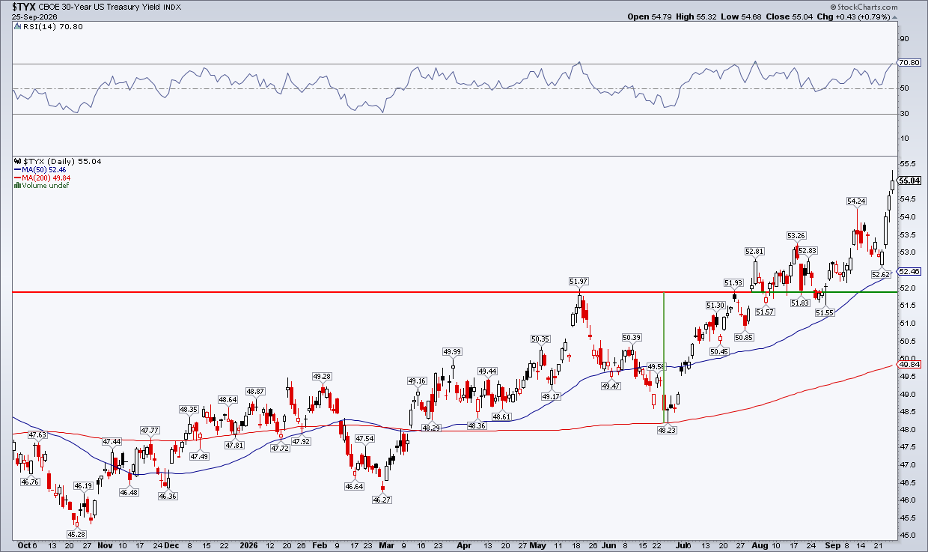
Taken together (XLU approaching support and $TYX just about achieving its upside target), there’s a reasonable case that Treasury rates are nearing at least a short-term peak. The MOVE volatility spike lends credence to the notion that the market is coming closer to a capitulation-like moment.
Bond bulls throwing in the towel is key; as in the stock market, orderly declines often need a big “whoosh” to the downside to set up a durable bullish reversal.
The Bottom Line
The bond selloff has intensified as the month has worn on. After a steady march higher in yields, a dose of fixed-income fear has rattled most equity sectors. Utilities could be the tell, and I see signs that the usually low-vol space has turned stretched to the downside. $TYX is near its target, while MOVE indicates that a bond market washout may be unfolding.
Disclaimer: This blog is for educational purposes only and should not be construed as financial advice. The ideas and strategies should never be used without first assessing your own personal and financial situation, or without consulting a financial professional.