Agribusiness ETF: Outside Reversal; Surges Off Bullish Setup Zone; Next Key Level
Key Takeaways
- Most of the components of the Agribusiness ETF (MOO) are in uptrends and up year-to-date.
- A weekly outside reversal affirms the support for the prior breakout.
- MOO surges off bullish setup zone and paves way for breakout.
The VanEck Agribusiness ETF (MOO) is setting up bullish as it affirms support with an outside reversal week and surges off a Bullish Setup Zone. Today's report and video will explain the rationale behind these zones and show the key level to watch for a breakout, and will also present a look at performance for the top 10 component stocks.
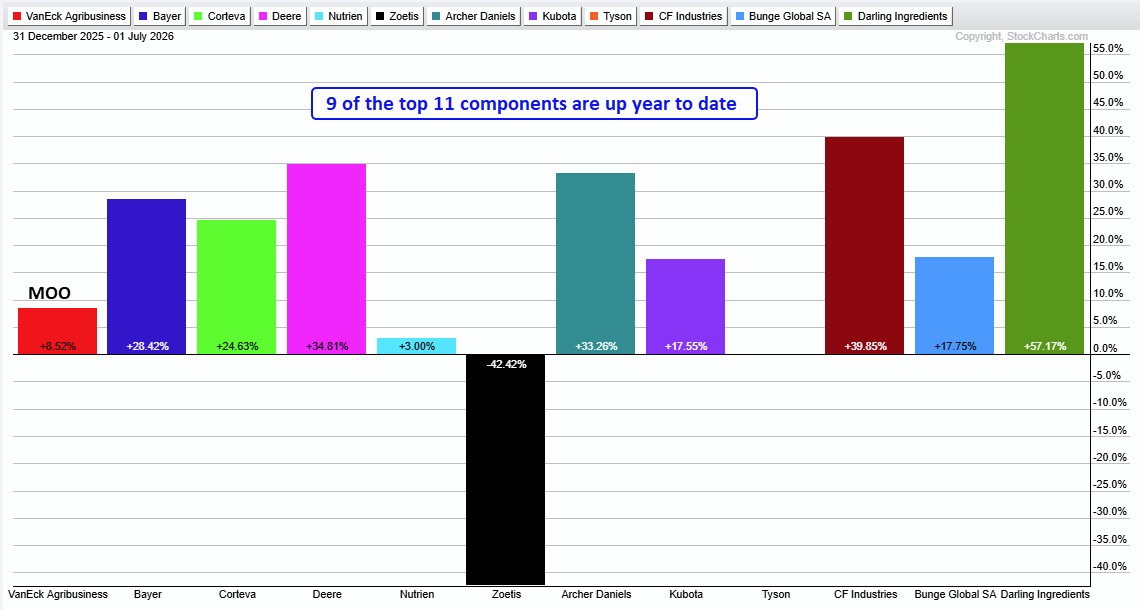
Nine of 11 Component Stocks Up in 2026
The first chart shows year-to-date performance for MOO and the top component stocks. MOO is up 8.5% year-to-date, and nine of the 11 stocks are up. Zoetis (ZTS) is the big loser and Tyson (TSN) is unchanged. 2026 performance shows more strength than weakness within the ETF.
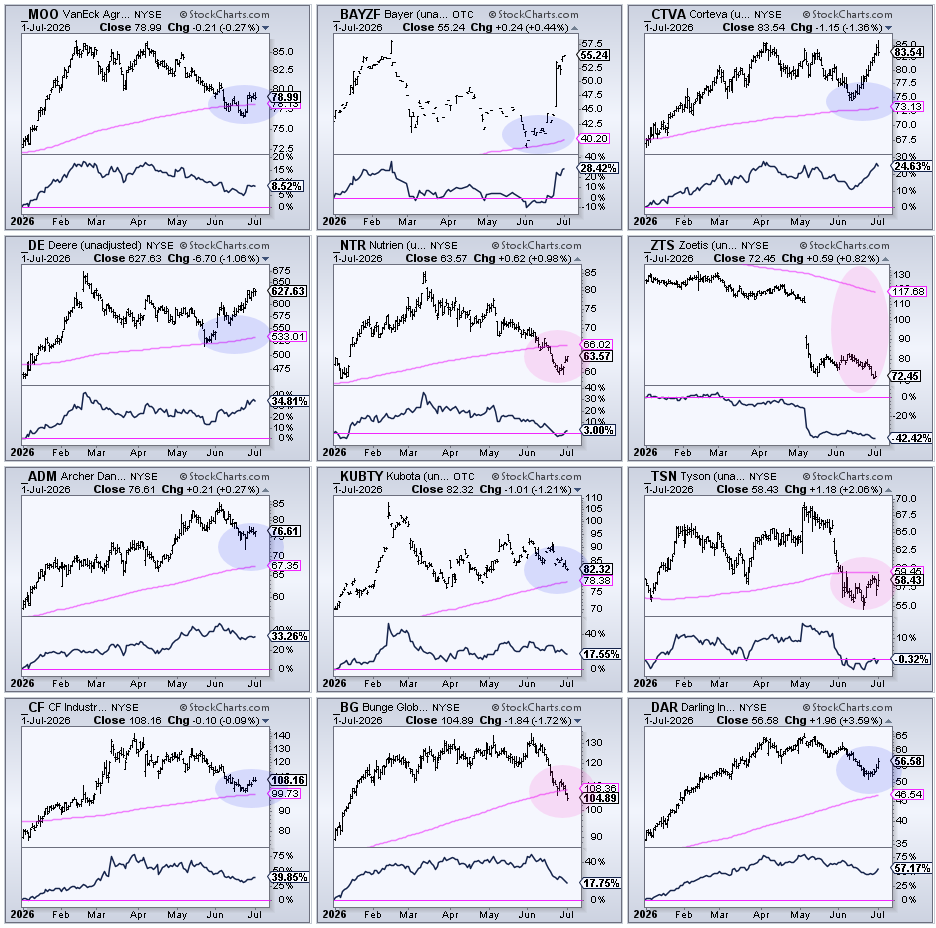
Seven of 11 Top Components in Long-Term Uptrends
The next image shows CandleGlance charts for MOO and the top 11 components. Each chart shows the 200-day SMA and year-to-date performance in the indicator window. In the upper left, MOO is battling its 200-day SMA. Elsewhere, seven of the 11 components are above their 200-day SMAs (blue ovals), which means the majority are in long-term uptrends. This supports the bullish thesis for MOO.
MOO Affirms Support with Outside Reversal
The first chart shows weekly candlesticks with three breakouts. First, MOO broke resistance at 70 with a surge off the April 2025 lows. Second, the ETF broke out of a falling channel in December. Third, MOO broke a major resistance zone in January (pink shading) and recorded a 52-week high.
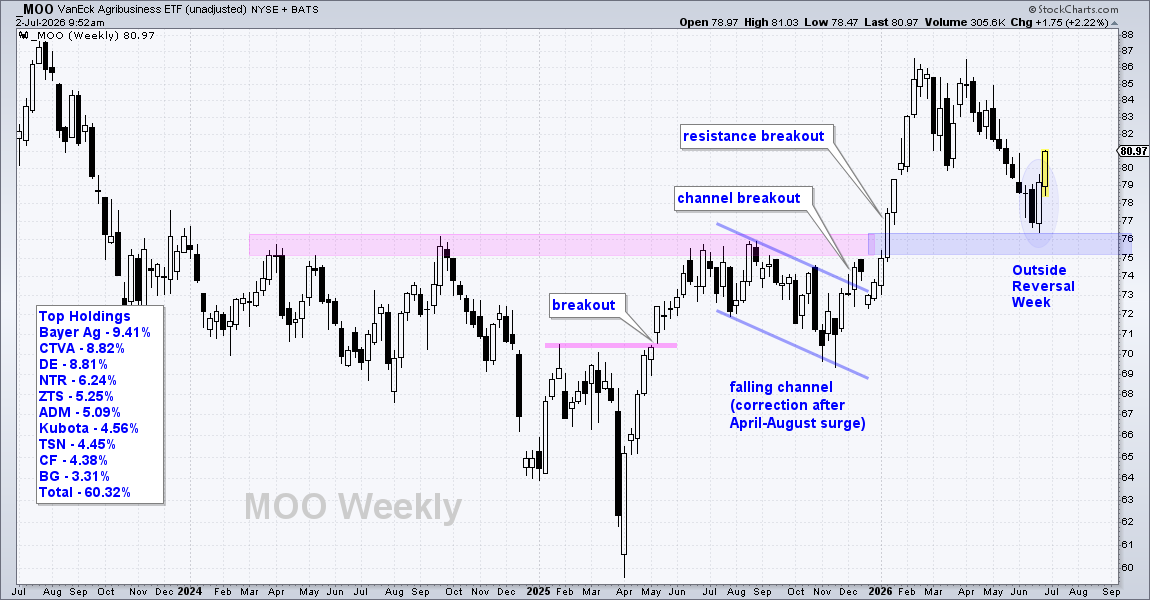
MOO caught my eye because it returned to the resistance zone and firmed with an outside reversal last week (blue oval). A classic tenet of technical analysis is that broken resistance turns into support. The outside reversal affirms support.
This pattern shows buyers stepping in as MOO opened weak on Monday (22-June), closed strong on Friday (26-June), and formed a long white candlestick. This candlestick also engulfed the prior black candlestick, which makes it a bullish engulfing pattern.
Recent Reports and Videos on TrendInvestorPro
- Small-caps Lead, Space Sets Up, Telecom Breakout
- Stock Setups: First Solar, Quanta and Arista Networks
- Copper and Base Metals Set Up Bullish
- Breadth Supports the Bull Market (%Above 200-day)
Click to take a trial and get our Master ETF ChartList.
MOO Bounces off Bullish Setup Zone
The next chart shows daily candlesticks with the 200-day SMA. When an ETF is in a long-term uptrend and correcting, I use retracements, the 200-day SMA, and prior breakouts to define Bullish Setup Zones. These are zones that may mark the end of the correction. Once price hits these zones, I look for signs of firming and buying pressure that may lead to a breakout reversal.
The blue shading marks a Bullish Setup Zone. Here, we have the 50–61.8% retracements, the rising 200-day SMA, and the prior breakout. It's normal for a correction to retrace around 50% of the prior advance and return to the prior breakout. In a long-term uptrend, the rising 200-day also marks a level to watch for signs of support.
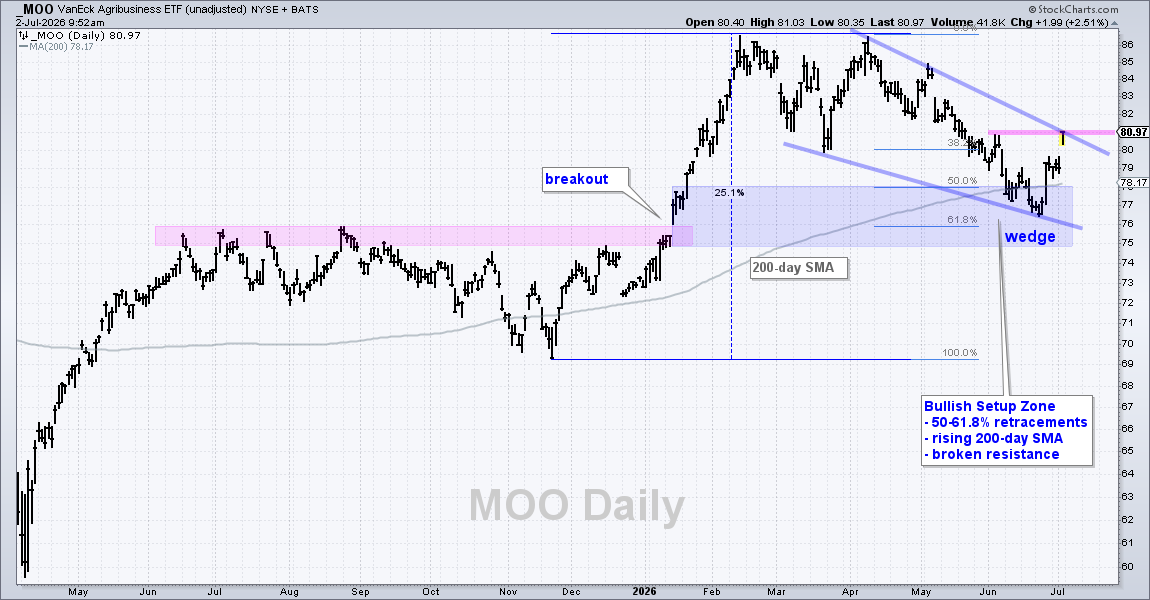
MOO firmed in this Bullish Setup Zone and surged the last seven days. A falling wedge defines the current correction with resistance marked at 81. A breakout here would reverse the falling wedge and signal a continuation of the long-term uptrend. Such a move would also shows follow through to the outside reversal (confirmation). Upon a breakout, I would re-evaluate on a close below 76.