The Bulls Have a Serious Market Breadth Problem

I was taught that a healthy bull market phase is marked by an expansion in new 52-week highs, an increase in breakout signals, and a general improvement in daily advance-decline data. So when the daily advance-decline data shows decliners outnumbering advancers by about a 4-to-1 ratio, as we observed on Wednesday, October 14, I feel that a healthy dose of skepticism is warranted.
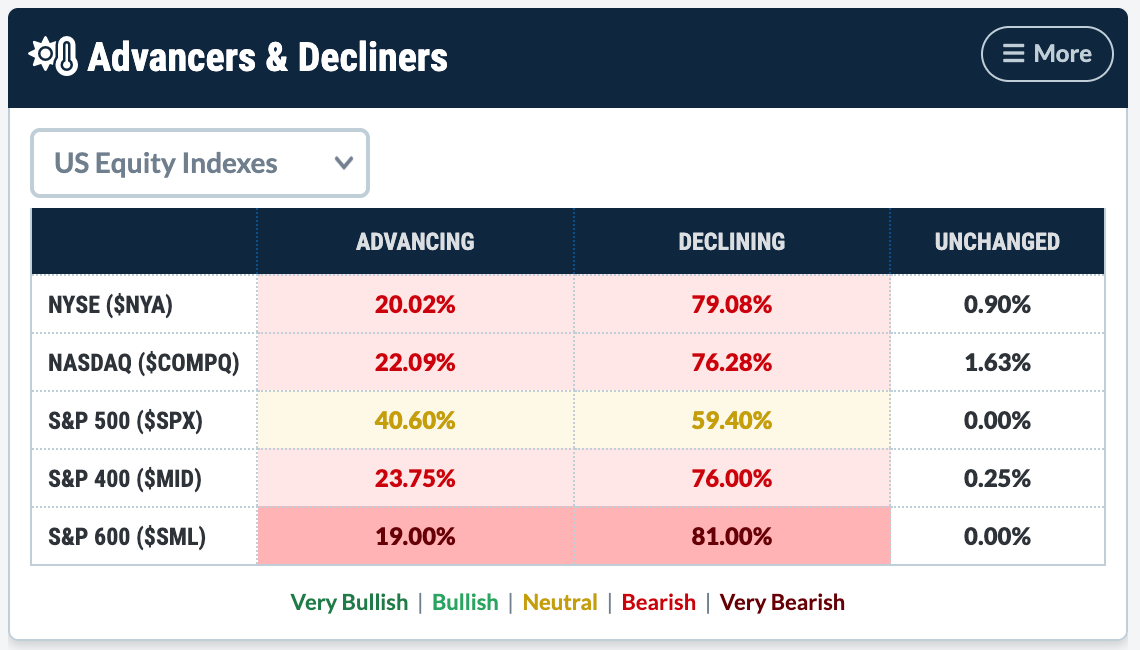
When breadth indicators remain weak, that speaks to a lack of broad participation in a bull market phase. Even though the major benchmarks remain near previous all-time highs, anemic breadth conditions speak to much weaker conditions “under the hood” of the equity benchmarks.
Let’s review three key market breadth indicators, reflect on what their current readings are suggesting in terms of participation, and identify specific signals that would tell us when conditions are beginning to improve.
Advance-Decline Data Indicates Short-Term Strength But Long-Term Weakness
Cumulative advance-decline lines provide a way to analyze the trend in the daily readings of advancers versus decliners, as shown above. And all four of the cumulative advance-decline lines for major US indexes currently sit below downward-sloping 50-day moving averages.
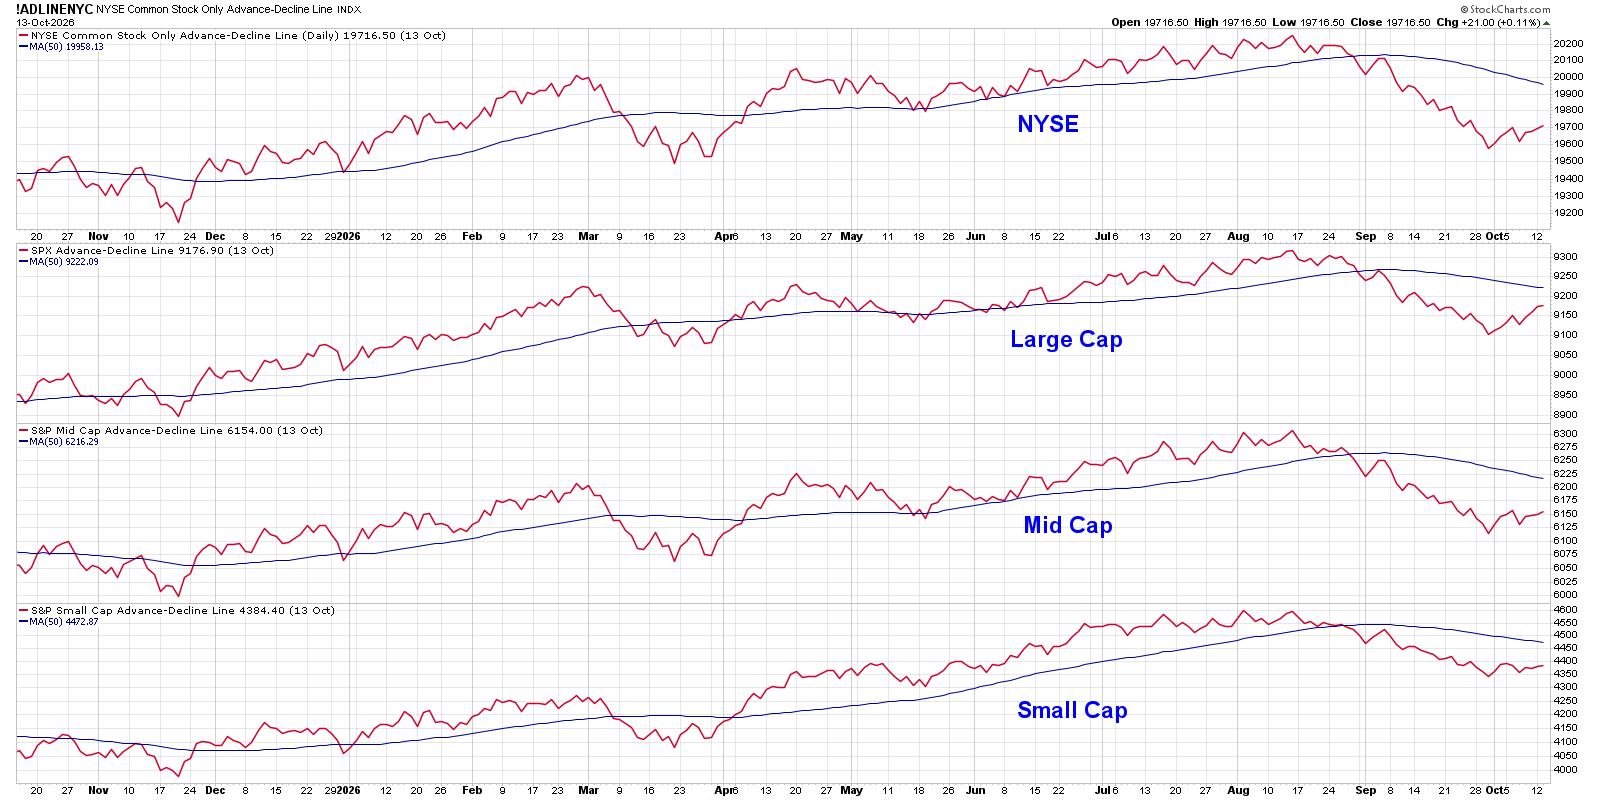
While the S&P 500 ($SPX) and Nasdaq ($COMPQ) remain above key moving average support, the advance-decline lines all broke their 50-day moving averages soon after reaching a new all-time high in mid-August. We can also see that the A-D lines have popped higher in October, a move most clearly illustrated through the McClellan Oscillator.
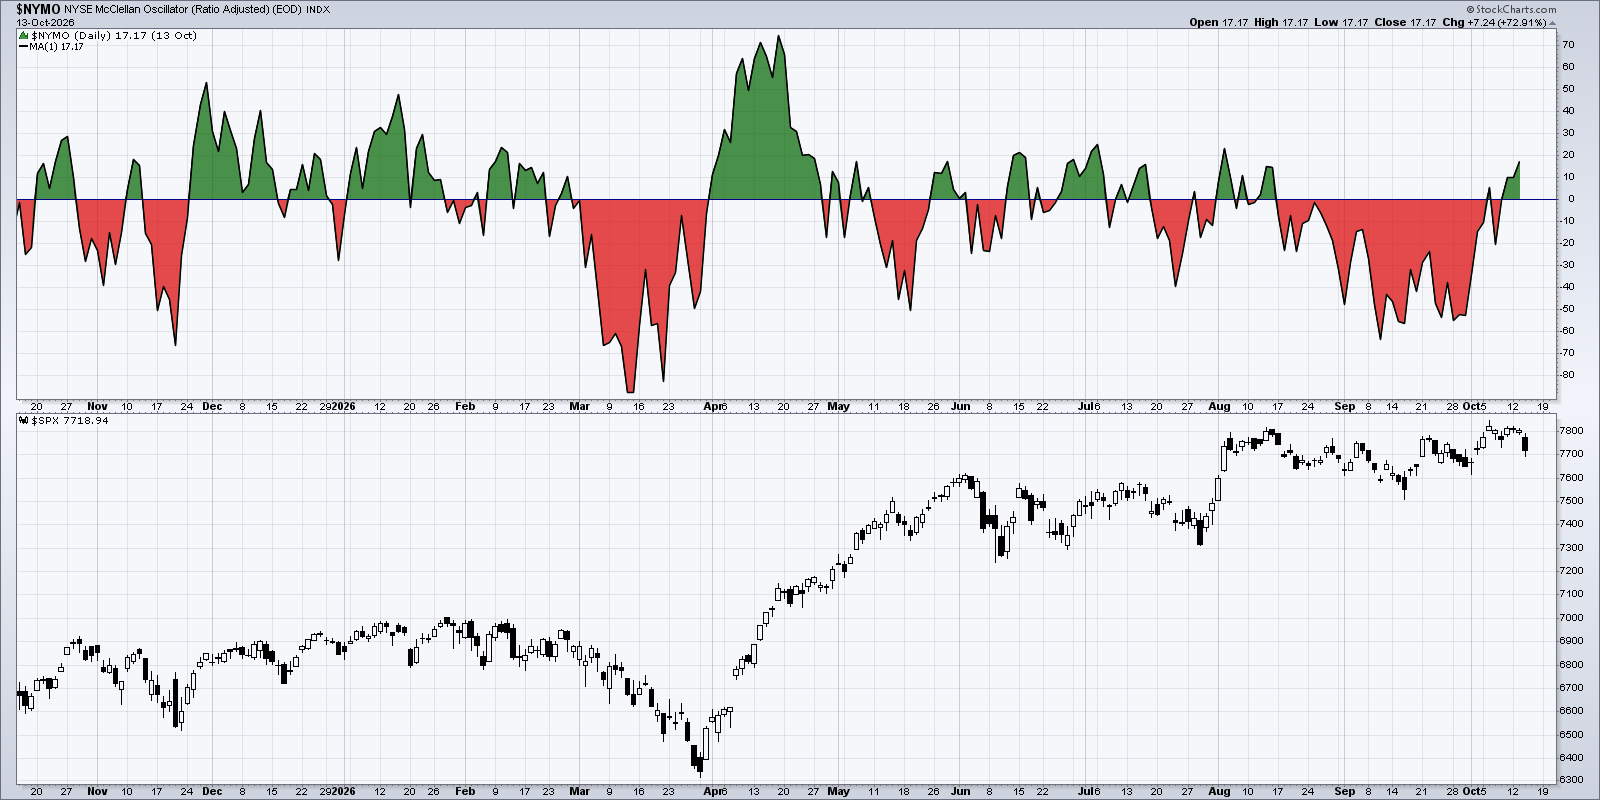
The McClellan Oscillator is based on the slope of the advance-decline lines, so moving above the zero line earlier this month confirms that the short-term trend is actually improving. If the McClellan Oscillator remains above the zero level in the coming weeks, then that could result in the advance-decline lines regaining their 50-day moving averages. For now, we see this as a short-term improvement in breadth, but not enough to upgrade the overall bearish thesis.
A Failed Zweig Breadth Thrust Suggests a Lack of Willing Buyers
The Zweig Breadth Thrust is a market breadth named after legendary strategist Marty Zweig. As I explained recently on our daily market recap show, a breadth thrust involves a breadth indicator rotating from a very bearish reading to a super bullish reading in a very short period of time.Strategists like Zweig knew that, after a market pullback, a big upswing in market breadth would often signal the beginning of a sustainable rally with much further upside potential!
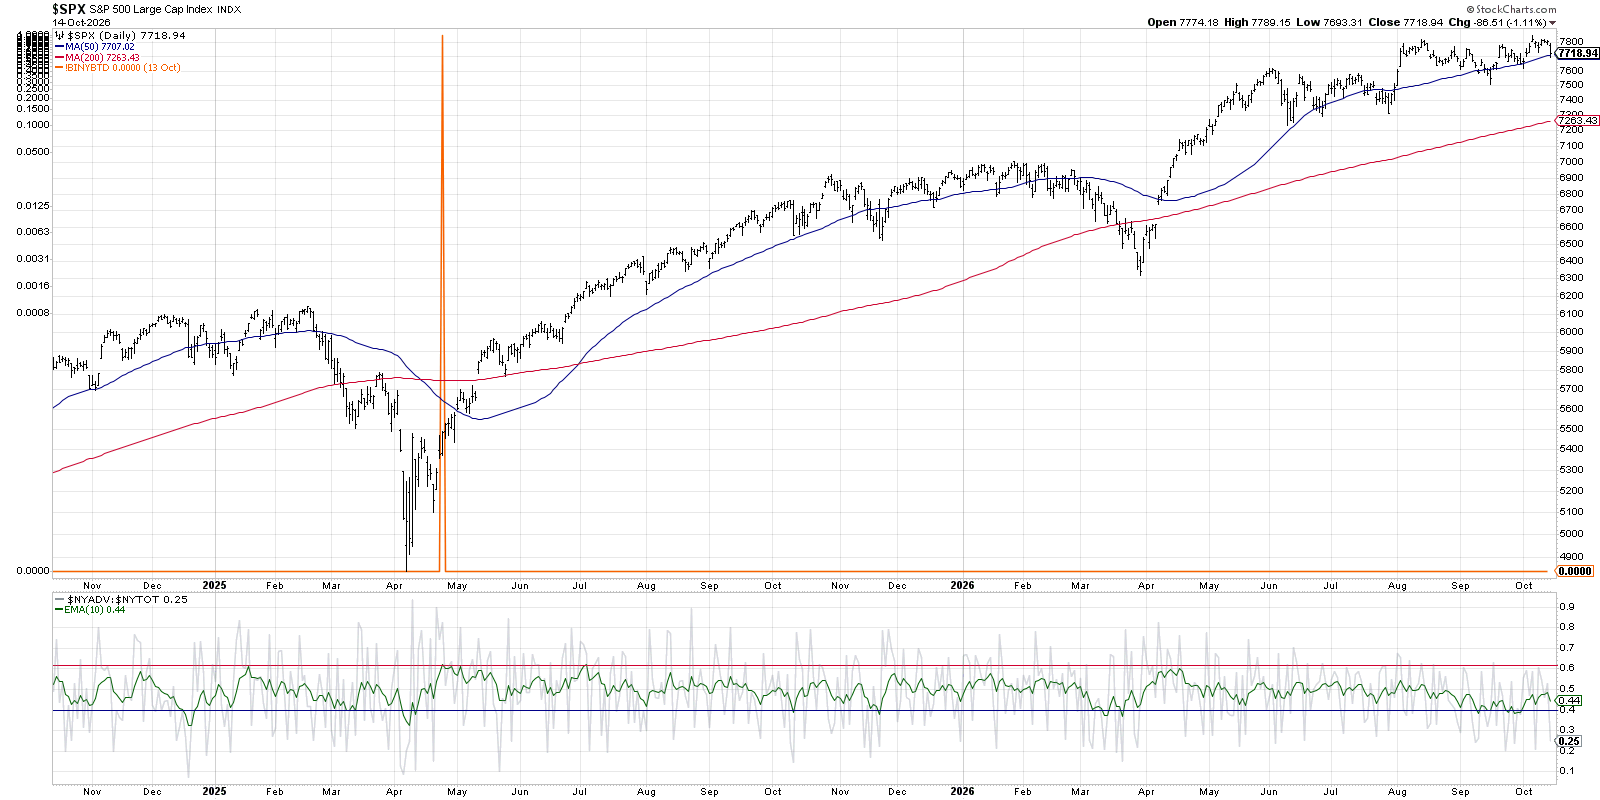
A Zweig Breadth Thrust is initiated when the percentage of daily NYSE advancers as a percentage of total NYSE listings dips below 40%. Then, over the next two weeks, the percentage needs to swing above 62%, which would represent a dramatic improvement in the breadth data and confirm the breadth thrust.
We can see a fantastic example of a completed signal back in April 2025, when weak breadth conditions going into the April market low quickly shifted to a bullish reading before the end of that month. Following the completed Zweig Breadth Thrust signal, the S&P 500 resumed a strong uptrend phase that lasted into the first quarter of 2026.
The Zweig Breadth Thrust was initiated again toward the end of September 2026, but, over the last two weeks, this indicator failed to get above the bullish threshold to complete the signal and indicate a bullish breadth environment. In this case, a lack of follow-through in breadth conditions speaks volumes about a lack of willing buyers that would usually complement a new bullish market phase.
Can This Market Rally Without Technology?
With the Technology sector currently making up about 40% of the S&P 500 index by market capitalization, the weak breadth conditions for the Nasdaq 100 confirm that this bellwether sector continues to struggle. The Nasdaq 100 Bullish Percent Index, which tracks the point & figure charts for the Nasdaq 100 members, shows that breakdowns are happening within this key growth benchmark.
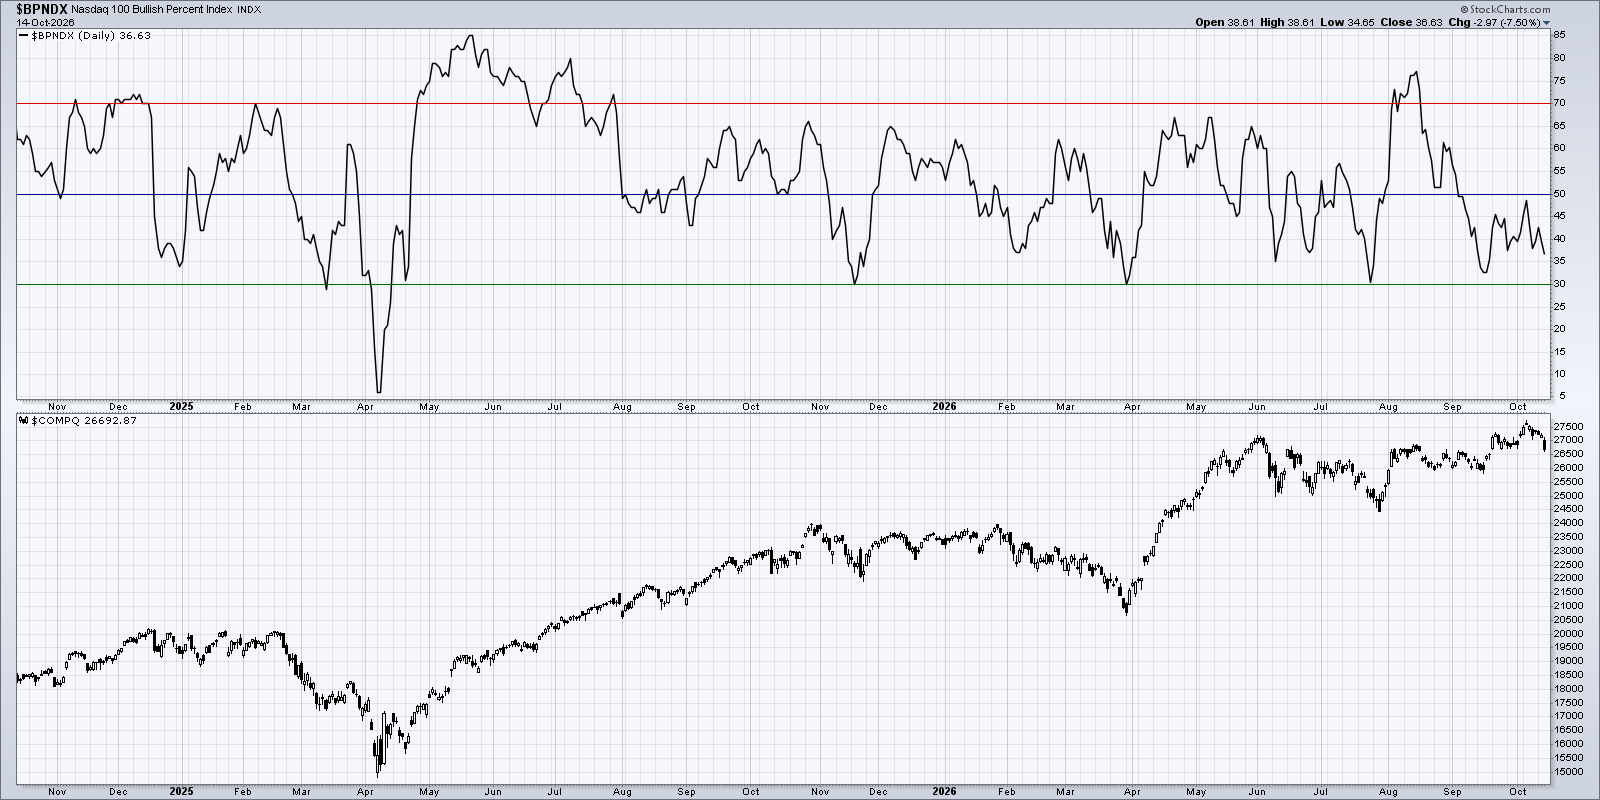
Earlier this month, the indicator almost reached the 50% level, which would at least show that most of the Nasdaq 100 members were in a bullish point & figure configuration. But, as the month of October has progressed, the Bullish Percent Index has rotated lower to reach about 36% this week. Until and unless the leading growth stocks in this index can regain positive momentum on their point & figure charts, it’s hard to imagine our major equity benchmarks mounting any meaningful move to the upside.
Market breadth readings can provide vital clues as to the participation of individual stocks during different market phases. Based on a quick review of these three important breadth indicators, a noticeable lack of buying power could be a powerful force preventing our equity benchmarks from experiencing significant upside in the coming weeks.
RR#6,
Dave
P.S. Ready to upgrade your investment process? Check out my free behavioral investing course!
David Keller, CMT
President and Chief Strategist
Sierra Alpha Research LLC
marketmisbehavior.com
https://www.youtube.com/@DKellerCMT
Disclaimer: This blog is for educational purposes only and should not be construed as financial advice. The ideas and strategies should never be used without first assessing your own personal and financial situation, or without consulting a financial professional.
The author does not have a position in mentioned securities at the time of publication. Any opinions expressed herein are solely those of the author and do not in any way represent the views or opinions of any other person or entity.