Visa and Mastercard Hit Record Highs as Credit Card Stocks Split in Two

Key Takeaways
- V & MA are on a tear, with bullish chart patterns pointing to potential price targets of $460 and $740, respectively.
- American Express on the high end and Capital One on the lower end of consumer exposure lag highlights a curious K-shaped spending picture.
- Upcoming Q3 earnings reports could confirm the leaders’ breakouts and offer fresh clues about retail spending heading into the holiday season.
U.S. nominal GDP hums along near 6%. Broad consumer spending hits records month by month. What's likely to be a strong holiday shopping season is on tap. But shares of traditional Consumer Discretionary companies remain in the gutter.
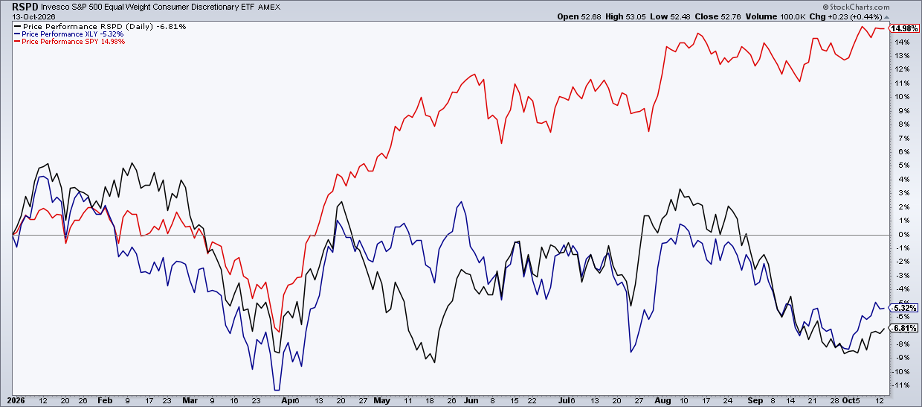
The Invesco S&P 500 Equal Weight Consumer Discretionary ETF (RSPD) is down 7% on the year, dividends included. That lags the SPDR S&P 500 ETF Trust (SPY) by more than 20 percentage points and marginally trails the cap-weighted sector ETF.
Two Credit Card Giants Defy Consumer Gloom
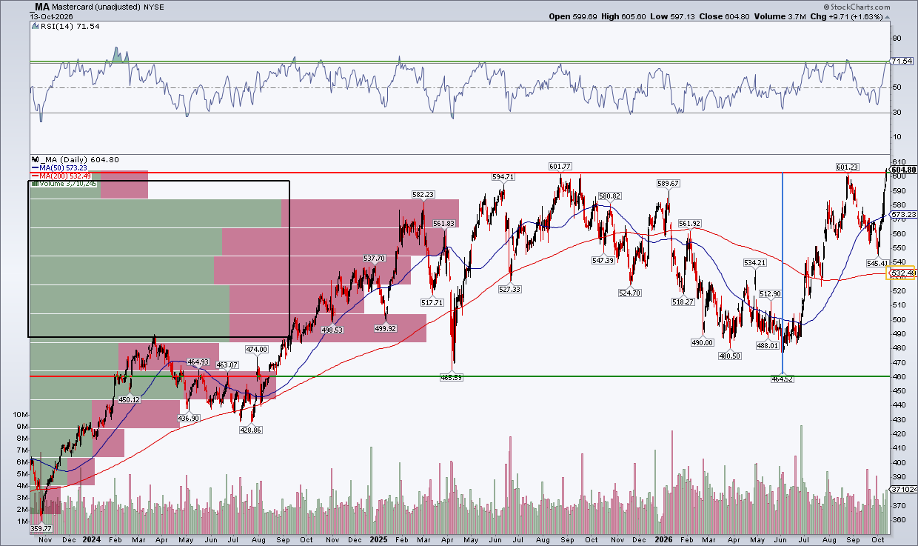
Couch those stats for a moment. Now pull up charts of Visa (V) and Mastercard (MA). These two Financials-sector stocks are at new record highs, despite notable relative weakness in RSPD.
What's the fundamental and macro signal there? That's up for debate. Perhaps spending trends will hold up amid record-low sentiment (as measured by the University of Michigan's October preliminary Current Economic Conditions Index). Maybe regulatory tailwinds are poised to blow following the midterm elections. We'll get a fresh read on Thursday via the September Retail Sales report.
But that's not our concern. We're focused on price action.
To be clear, not everything is a treat in the credit card services space. American Express (AXP) has been a constant upper-income and business-travel-spending warning sign throughout 2026. What's more, Capital One (COF) hasn't been positive on the year since early January. Both of those stocks are down 15%-plus coming into the heart of the Q3 earnings season.
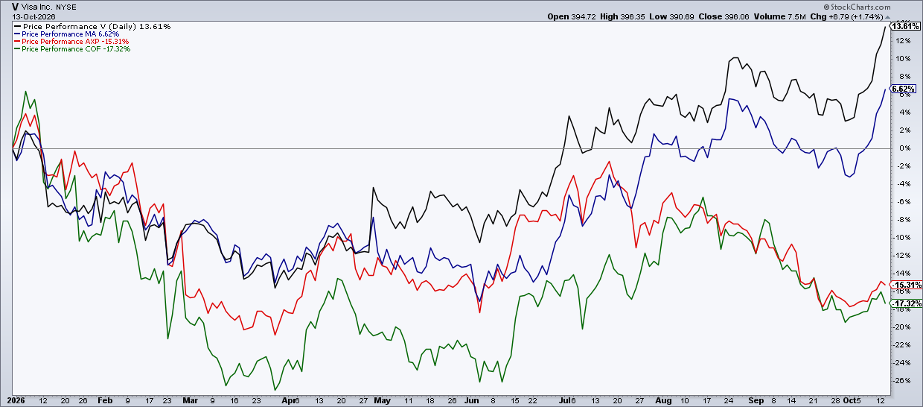
So, the clear pairs trade is long V and MA and short AXP and COF. For long-only swing traders, the two largest credit card stocks have nothing but blue sky above. How high could they go? Let's figure it out.
Visa Eyes $460 After a Powerful Breakout
Starting with the heavy hitter in the group, Visa shares were on a nine-session heater coming into CPI Day. Up 10.2% over that stretch, the $740 billion market cap firm's stock also prints relative highs to the S&P 500 dating back to January.
Notice in the chart below that V's powerful thrust came after what appeared to be a bearish false breakout in late August. Shares ticked to modest new highs before slipping 7.5% just before the current rally took shape.
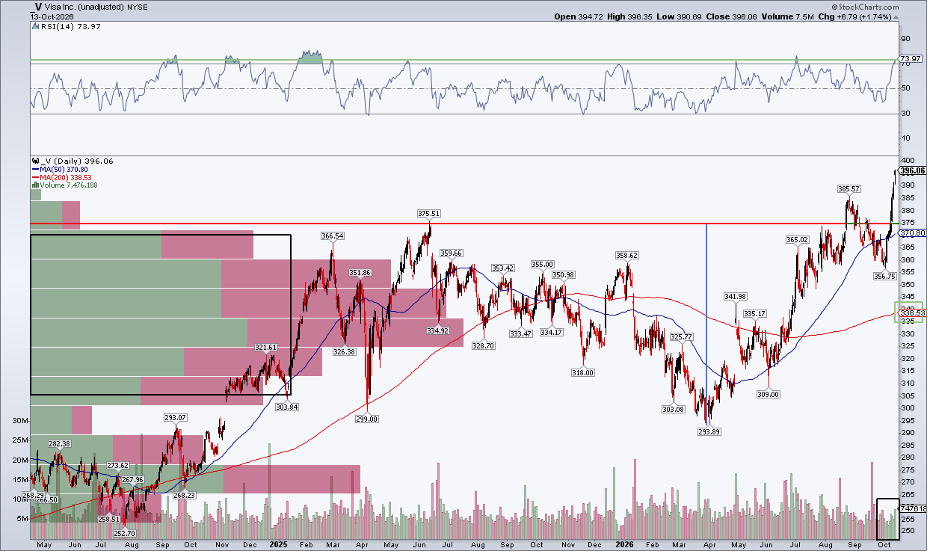
But with the stock back above the $376 June 2025 peak, V appears poised for a durable run. How high?
We can calculate a measured move price target by taking the depth from the mid-2025 high to the March 2026 low, then adding that to the recent breakout. The resulting target is near $460. That's a ballpark gauge of the potential rally. I also like that the RSI momentum oscillator at the top of the SharpChart is above 70, helping to confirm the price breakout.
Furthermore, the long-term 200-day moving average is on the rise, proving that the bulls control the primary trend. There's a high number of shares traded starting at $370, which should offer a cushion if we see a post-earnings decline. (Visa reports earnings on Tuesday, October 27.)
Mastercard's Next Stop: $740?
Visa is everywhere the bulls want to be. Can the bulls also buy Mastercard? It sure looks that way.
MA's chart is a more classic cup-with-handle pattern, given that the stock has struggled twice near $600. Shares retreated 22% from the August 2025 high to a June 2026 low in the mid-$400s (defending its April 2025 nadir).
After recovering to $601 (almost to the penny the high from the previous year), MA settled last Tuesday at a record. Confirmed by a strong RSI and up eight days in a row on its own, the measured move target here is close to $740, implying 20%-plus gains ahead. A weekly close above $601 would provide further confidence.
American Express Faces a Technical Test
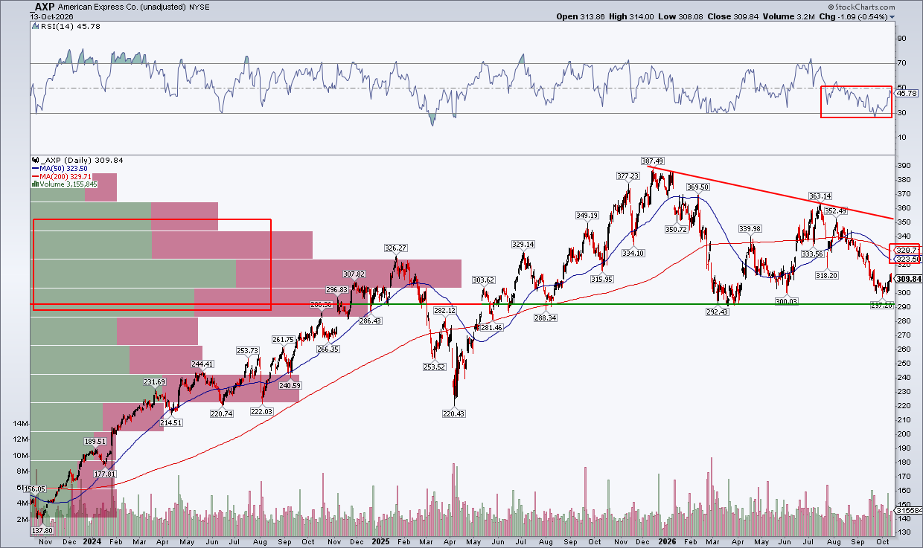
V and MA litter the S&P 500 52-week high list. AXP and COF, not so much. American Express is considered a barometer of the upper-income consumer and corporate traveler, which makes its tepid absolute and relative performance all the more curious.
For technicians, $290 is the line in the sand, with a descending triangle in play ahead of its October 23 Q3 report. RSI is weak, the 200-DMA is on the decline, and there's plenty of wood for the bulls to chop amid congestion up to $360.
Capital One Also Struggles
Capital One is in the bears' wallet right now, too. After peaking at the start of the year, the consumer finance firm's shares remain in a 24% drawdown. AXP and COF have not caught bids like V and MA, suggesting a more mixed consumer picture at the upper and lower ends of the consumer stack.
Eyes on Earnings
The next immediate catalyst for all these stocks is their respective quarterly reports. You can review earnings dates, historical beat/miss trends, and other data on the StockCharts Symbol Summary page. Knowing when volatility may strike is key to managing risk. There's also a link to options data, along with intel found in the StockCharts Options Play Strategy Center.
The Bottom Line
There's a K-shaped construct among credit card stocks. V and MA are the haves, while AXP and COF are the have-nots. Earnings are on tap, which could help further confirm new highs in the former pair. How the latter two perform could provide the ultimate macro tell... strong reactions, and the holiday-shopping season might indeed be all the merrier.
Disclaimer: This blog is for educational purposes only and should not be construed as financial advice. The ideas and strategies should never be used without first assessing your own personal and financial situation, or without consulting a financial professional.