Before You Buy Your Next Stock, Check These 3 Things
It was an exciting week on Wall St. The S&P 500 ($SPX) and Nasdaq Composite ($COMPQ) closed at record highs, then sold off. But the week ended with the major indexes closing higher. The excitement wasn’t limited to Wall Street; we’ve had plenty happening here at StockCharts too.
This week’s update:
- High-def charts are popping up everywhere
- Build a process you can trust
- Join the StockCharts community
Beautiful charts, better analysis
You’ve heard me talk about our new high-definition SharpCharts, and I want to start by thanking everyone who has taken the time to share feedback. I hope you’ve been enjoying the sharper, cleaner charting experience as much as we have!
In fact, we love the new look so much that we’ve expanded high-def charts. You’ll now find them in different ChartList views, on the Symbol Summary and Market Summary pages, and in many other areas across StockCharts.
But what makes these charts special? To see the difference, compare the high-def vs. the standard definition charts below.
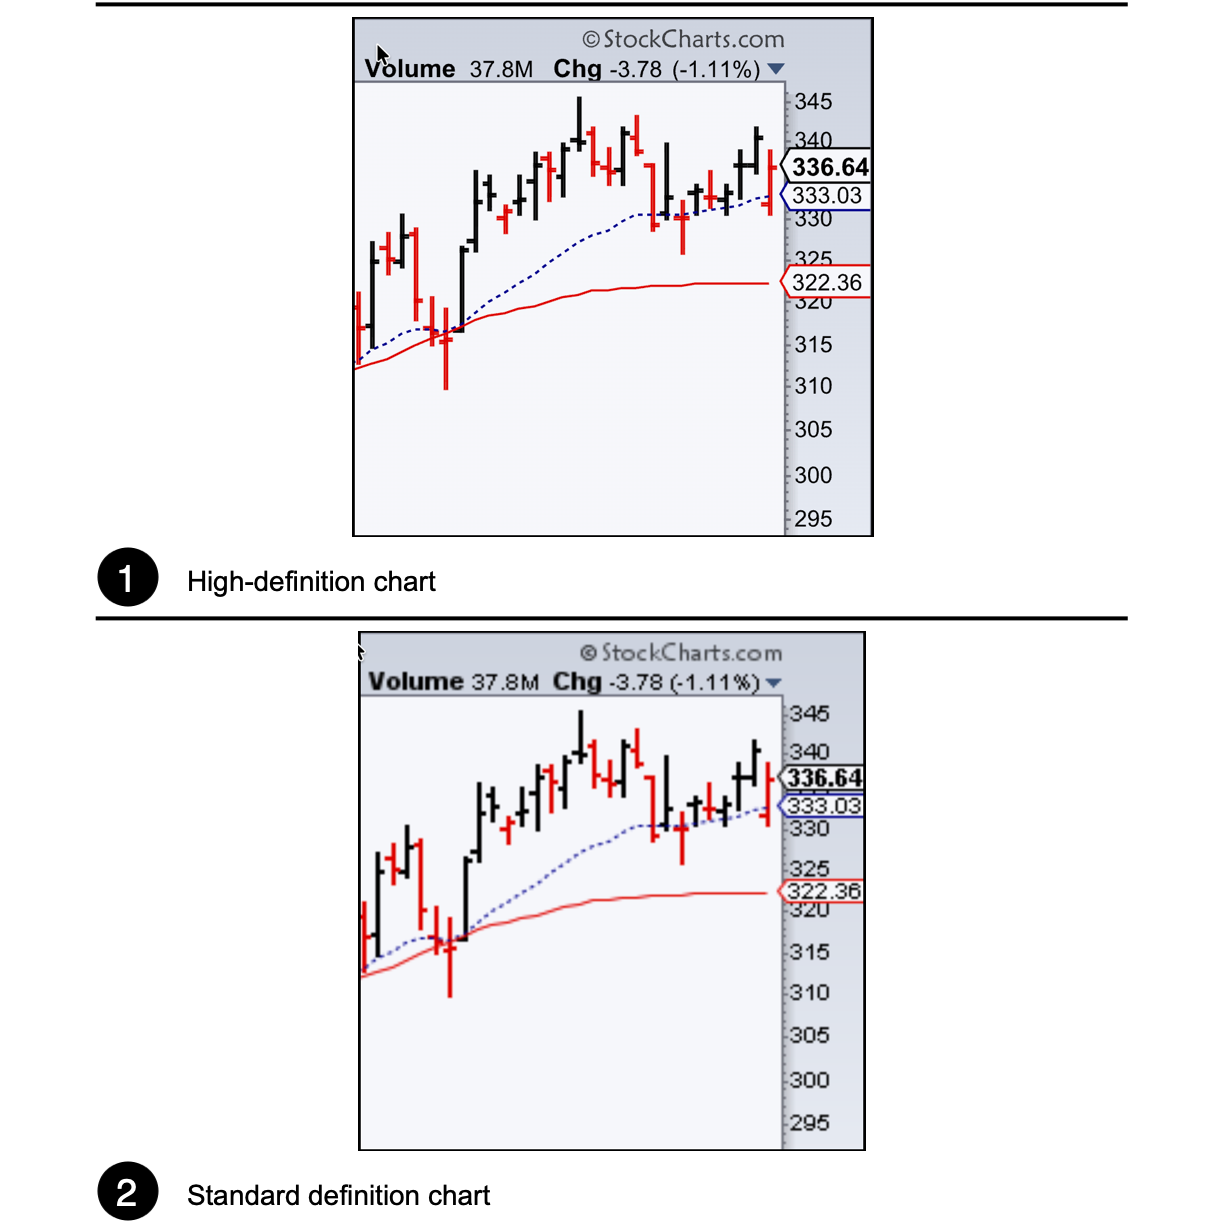
If you love analyzing charts, you will appreciate the cleaner and crisper price bars, moving averages, and price data in the top chart. You don’t have to have a lot of overlays or indicators on your charts. Sometimes, a few studies are all you need. Whether you prefer a chart with few indicators or one packed with technical studies, StockCharts gives you the flexibility to build charts that suit your investing or trading style.
The best chart is the one that helps you make better decisions.
Build a process you can trust
Do you follow a process when deciding which stocks or ETFs to buy?
It’s easy to get caught up in the excitement around a stock. You may have heard an analyst recommend it, read about it on social media, or asked an AI tool for investment ideas. While hearing opinions can be helpful, though, acting on them without doing your homework can be costly.
I’ve learned that lesson. On more than one occasion, I’ve entered a trade based on someone else’s recommendation, only to watch it move against me. I ended up spending more time and energy managing a losing position to reduce my loss. If only I had done my due diligence!
You don’t need a complicated trading system to make disciplined decisions. Here’s a simple three-step process I use when evaluating a stock or ETF.
- Start with the trend. Is the broader market in a bullish or bearish trend? I prefer to invest in stocks or ETFs that are trading in the same direction as the overall market.
- Check the moving averages. Where is the price trading relative to its 21-day exponential moving average, 50-day simple moving average, and 200-day simple moving average?
- Confirm momentum. If the trend direction of a stock/ETF aligns with the overall market’s trend, check the Relative Strength Index (RSI). Is it approaching or above 70? A strong RSI can signal increasing momentum, but a reading above 70 could mean a stock is overbought. So it helps to look at momentum within the context of the broader trend.
If all three line up, decide on your entry, stop loss, and profit targets.
This is just a starting point and, over time, you can build on it. There are plenty of tools on StockCharts that can help you automate your process. You can set alerts for when RSI crosses above 70, or when price reaches a moving average. When you’re ready to level up, you can use our Screener and Scanning tools to narrow the universe of stocks and ETFs. What’s important is to create a process that works for you.
Bonus month special ending soon
If you’ve been thinking about becoming a StockCharts member, here’s a great opportunity for you.
Our two free months of StockCharts special is still on, but only till Sunday, October 11, 2026. Whether you’re looking to sharpen your chart analysis, find new investment opportunities, or become a more disciplined investor, we’d love to welcome you to the StockCharts community.
👉 Claim your two free months of StockCharts!
Have a great weekend!