Bitcoin's Uptrend Faces a Critical Test at $80K

Bitcoin has pulled back this week after a compelling run to $87K in September. While the primary uptrend appears to remain intact, the severity of this week’s drop certainly has caused me to revisit the thesis and gather a new round of technical evidence.
The key question: is this week’s pullback just a plain vanilla drawdown within an uptrend phase, or could this mark the beginning of a more painful corrective move?
Today, we’ll start with a quick review of the daily chart of Bitcoin, focusing on support levels and momentum characteristics. Then, we’ll apply our proprietary Market Trend Model to put this week’s action into proper context, and from there we'll finish with a breakdown of a Bitcoin-related equity play also showing vulnerabilities here.
A moving average test suggests an uptrend in question
We’ve been constructive on the Bitcoin chart since its decisive breakout above the $67K level back in August. We saw that breakout as an upside resolution to the consolidation phase in June and July, and a follow-through above the 200-day moving average appeared to complete the bullish thesis.
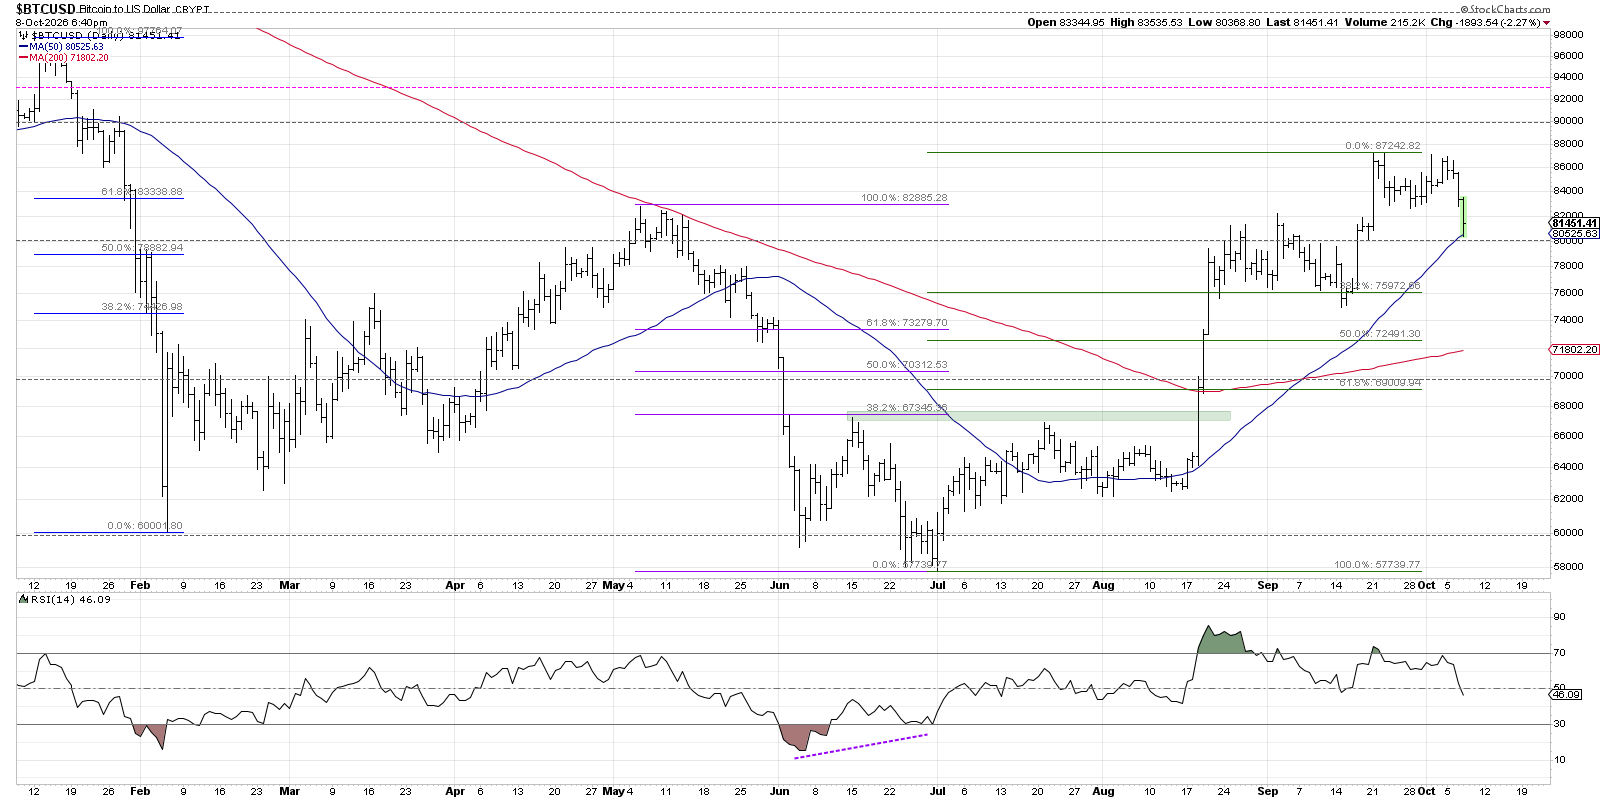
As Bitcoin popped above $67K and then further above $70K, the RSI moved above 60 to confirm upside momentum support. Subsequent new swing highs in August and September generally saw the RSI push above 70, confirming the strong momentum characteristics.
The RSI has failed to push above 70 so far in October, with momentum waning as Bitcoin appeared to stall out around $87K. Now, the question is whether the RSI will hold the important 40 level as the price tests initial support at the 50-day moving average. If Bitcoin is able to hold support around $80K and the RSI remains safely above 40, then we’re inclined to label this as a brief, albeit sudden, pullback within a larger uptrend phase.
Our Market Trend Model indicates a bullish medium-term trend
Though we primarily apply our proprietary Market Trend Model to the S&P 500 weekly data, we also apply this technique to several asset classes and ETFs as part of our Monthly Chart Review for premium members. In our latest monthly effort, we noted how the medium-term model remains bullish for Bitcoin, with the long-term model close to turning bullish as well.
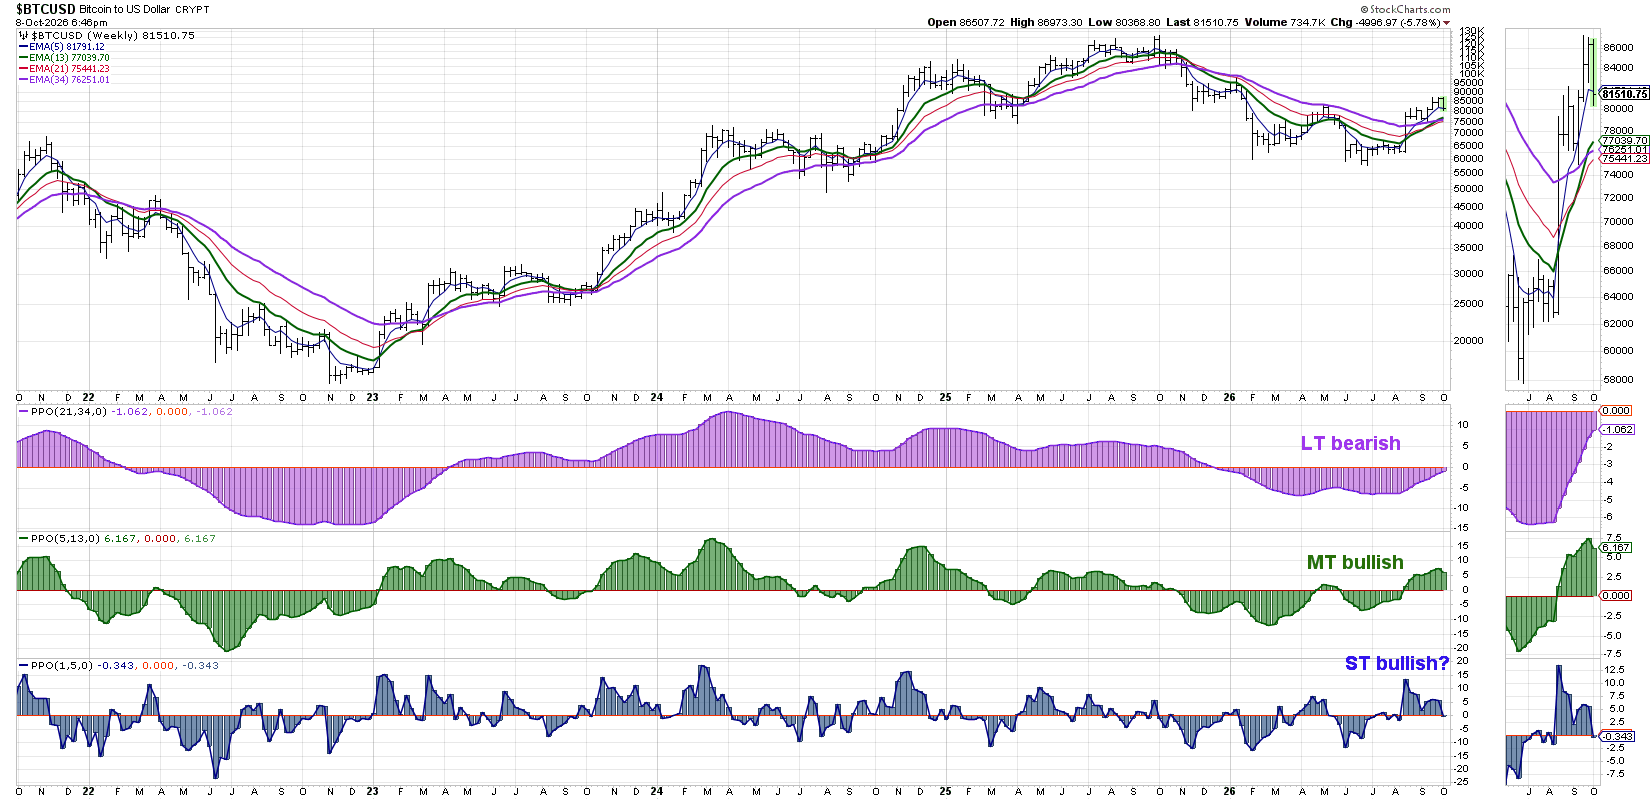
Our long-term model actually turned bearish back in Q4 2025, as Bitcoin pulled back from all-time highs around $125K. The medium-term and short-term models both turned bullish in August when Bitcoin turned back higher after pushing below $60K. So, with the medium-term and short-term models bullish and the long-term model still bearish, we’ve been treating Bitcoin as a compelling cyclical opportunity within a secular downtrend phase.
Even if the short-term model turns negative this Friday, the medium-term model remains the most important tell to determine the primary trend. And even with a bearish short-term signal this week, a bullish medium-term model would help us remain confident in a tactical pullback within a larger bullish phase for Bitcoin.
Coinbase features a frustrating “gap and fail” pattern
What can we learn from reviewing charts in assets that are "tangential" to Bitcoin? Coinbase (COIN) provides a fairly straightforward play on the crypto space, and a quick review of the chart shows that a consolidation phase is still very much in play.
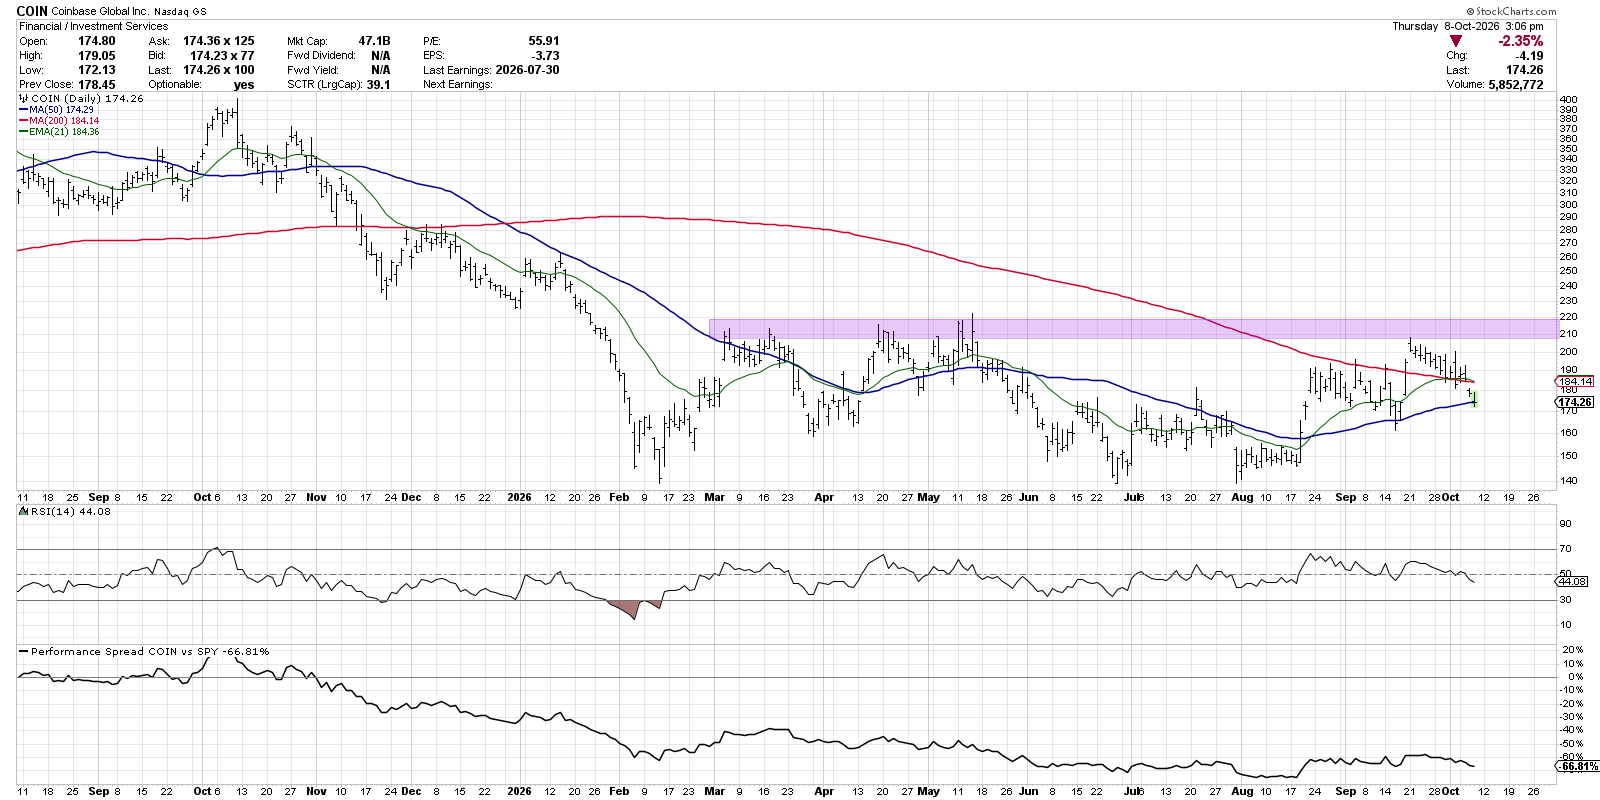
Coinbase strikes me as a chart in a clear consolidation phase, with confirmed support around $140 and a consistent resistance range around $210–220. As Bitcoin broke above $80K in mid-September, COIN mounted an encouraging move above the 200-day moving average. But that gap higher last month ended up being a short-term peak, as a lack of willing buyers caused the price to quickly deteriorate.
So, with a “gap and fail” pattern as the price once again approached a clear resistance level, Coinbase appears to still be safely entrenched in a consolidation phase. If we can observe a move above this resistance range, along with an improvement in momentum to confirm the breakout, we’d be convinced of much greater upside potential for COIN. However, with Bitcoin stalled out and Coinbase remaining in a sideways trend, we’re looking for opportunities elsewhere.
Want to track how charts like Bitcoin and Coinbase evolve in the days and weeks to come? We’ll share the latest observations and insights on our daily market recap show!

RR#6,
Dave
P.S. Ready to upgrade your investment process? Check out my free behavioral investing course!
David Keller, CMT
President and Chief Strategist
Sierra Alpha Research LLC
marketmisbehavior.com
https://www.youtube.com/@DKellerCMT
Disclaimer: This blog is for educational purposes only and should not be construed as financial advice. The ideas and strategies should never be used without first assessing your own personal and financial situation, or without consulting a financial professional.
The author does not have a position in mentioned securities at the time of publication. Any opinions expressed herein are solely those of the author and do not in any way represent the views or opinions of any other person or entity.