October Surprise: S&P 500 Now Leads for the First Time This Year, Clues on the Next Move

Key Takeaways
- The S&P 500 regained the YTD edge over small caps and international stocks as U.S. large caps notched a record high this week.
- Rising U.S. Treasury yields and a stronger dollar create fresh headwinds for rate-sensitive SMIDs and international markets.
- U.S. small caps and European equities now face key technical tests, with IWM still benefiting from seasonal tailwinds and eyes on France’s stock market.
Tuesday's S&P 500 ($SPX) record close was one for the books. It marked a two-month gap between all-time highs (comparable to the June-to-August consolidation) and came, once again, with exceptionally weak breadth when looking back over the last several weeks. While the count of new highs edged out the number of new lows, several corners of the global stock market did not join the party.
Something remarkable occurred on October 6. The SPDR S&P 500 ETF (SPY) turned positive on the year versus both the iShares Russell 2000 ETF (IWM) and the Vanguard FTSE All World ex-U.S. ETF (VEU). Domestic small-caps and international stocks had led U.S. large caps for all of 2026... until Tuesday. That's a cool stat, but what does it mean for traders? Well, it's all about momentum and intermarket trends, so let's double-click on that.
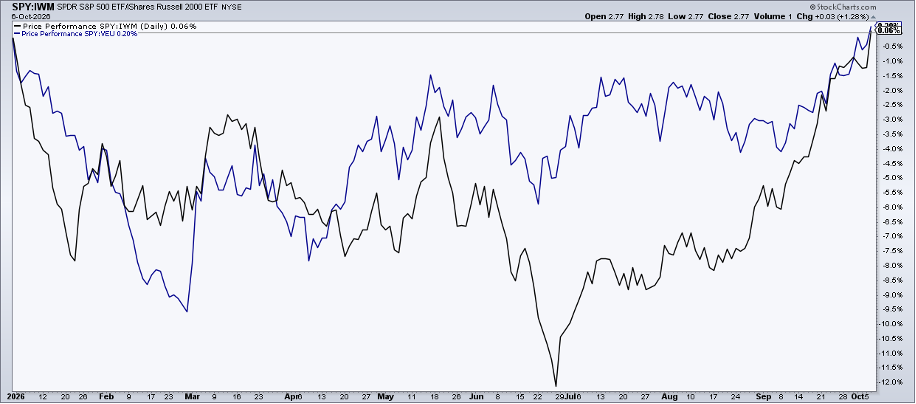
Relentless Rates
It's no secret that higher Treasury rates are the dominant theme leading into the Q3 earnings season. After a brief respite earlier in the week, yields are back on the rise, with the 30-year U.S. Treasury yield notching its highest level since 2002 at 5.7%. Real yields continue their ascent, as well, pressuring equity risk premiums at home and abroad.
As rates rise, so does the U.S. Dollar Index ($USD). Previously, I profiled a possible path toward 108+ on the $USD. In such a scenario, Treasury prices (bond prices and yields move in opposite directions) would likely continue their descent, rate-sensitive SMIDs would struggle, and ex-U.S. ETFs would fall further into the YTD red versus the S&P 500.
I remain bullish on small caps through November, but resting on the laurels of historical seasonal trends is not the strongest argument. Nor is small caps' modest 14x price-to-earnings ratio. I still eye IWM's 200-day moving average, along with the $271 to $275 zone.
Not discussed last week was the ETF's bellwether 50-DMA.
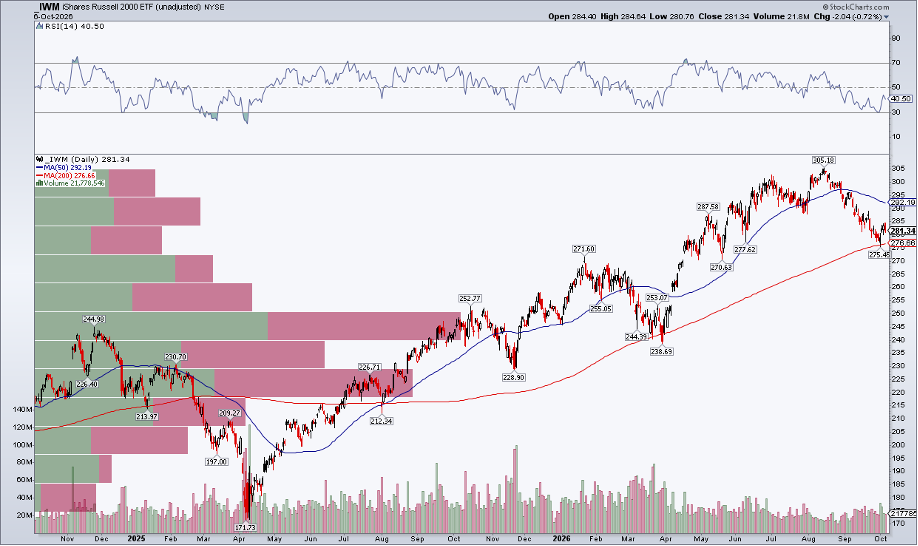
While moving averages don't always indicate where buyers and sellers lie on the chart, this shorter-term trend indicator line has been crucial for bulls and bears back to November 2025. It's something to watch. As it stands, the falling 50-DMA, which is far above the current price, is a headwind amid all the midterm-year calendar tailwinds.
Global Momentum Keeps Waning
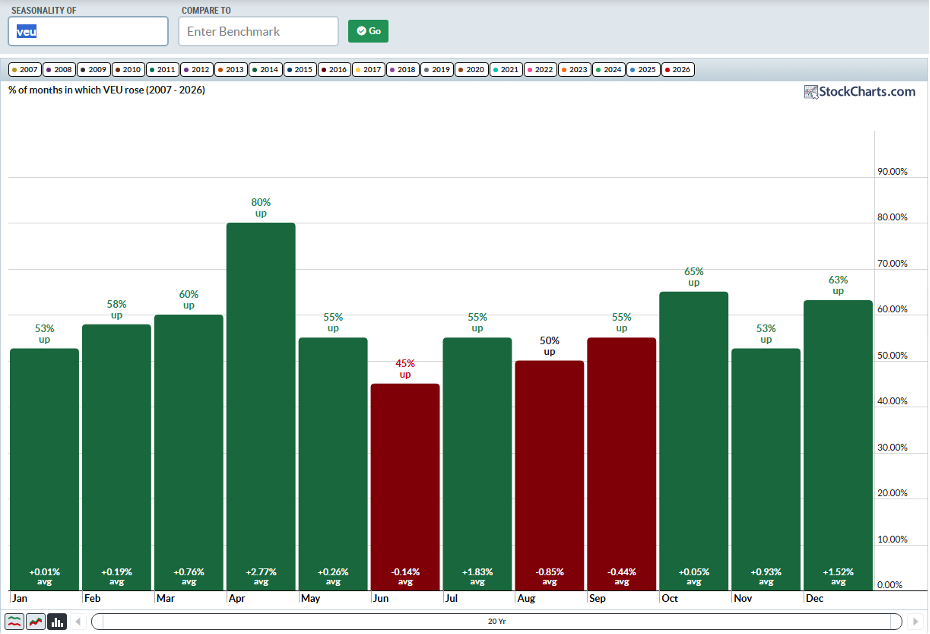
VEU, meanwhile, has a smaller seasonal sample size. October has been a virtual toss-up, averaging just a gain of five basis points in data back to 2007, and higher 65% of the time. November and December are sequentially stronger. More importantly, ex-U.S. stocks' technical chart echoes relative softness.
Notice in the chart below that the ETF's momentum has waned throughout 2026. The RSI momentum oscillator at the top of the view reveals lower highs, even when price tagged a marginal new record in early September. For a moment, it appeared that international stocks were going to recapture relative strength (as the S&P 500 initially peaked on August 13).
But intermarket forces had other ideas.
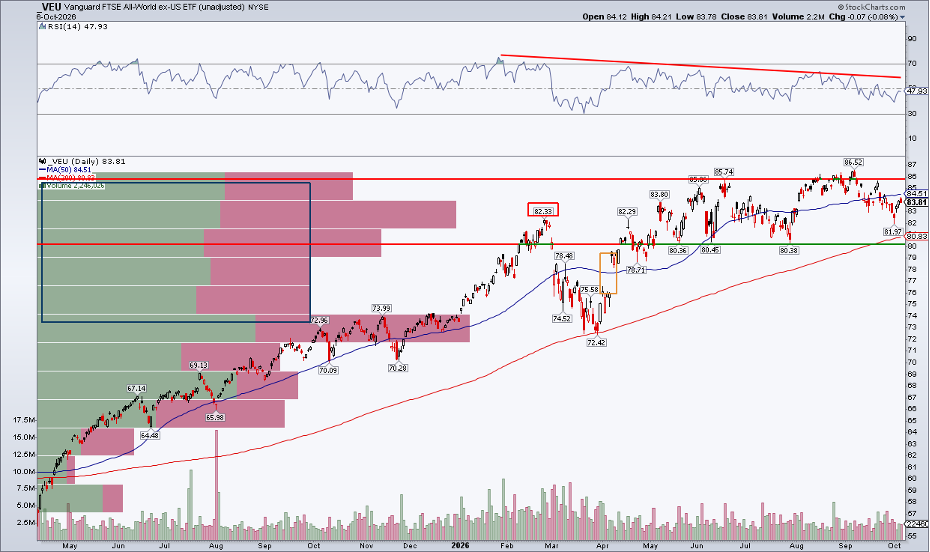
In the here and now, VEU is stuck in a range. Support is near $80, with the rising 200-DMA just above that level, while the modest false breakout a month ago serves as resistance. Also, look at the volume-by-price profile on the left side of the SharpChart above. Whereas the S&P 500 has blue skies overhead, VEU faces heavy congestion above and below the current spot.
All this augurs for year-end churn, not a decisive breakout. And if that dollar jolt to 108 plays out, VEU could easily fill the old April 8 gap around $76 (boxed in orange).
Lights Out on France?
Pressuring VEU the most? Europe. Ahead of Halloween, price action among the overseas bourses has been dreadful.
Let's hop over to the StockCharts Market Summary page. Under the Equities section, select Country Funds and set the Timeframe to One Month at the top of the page. Next, sort by % Chg (1M).
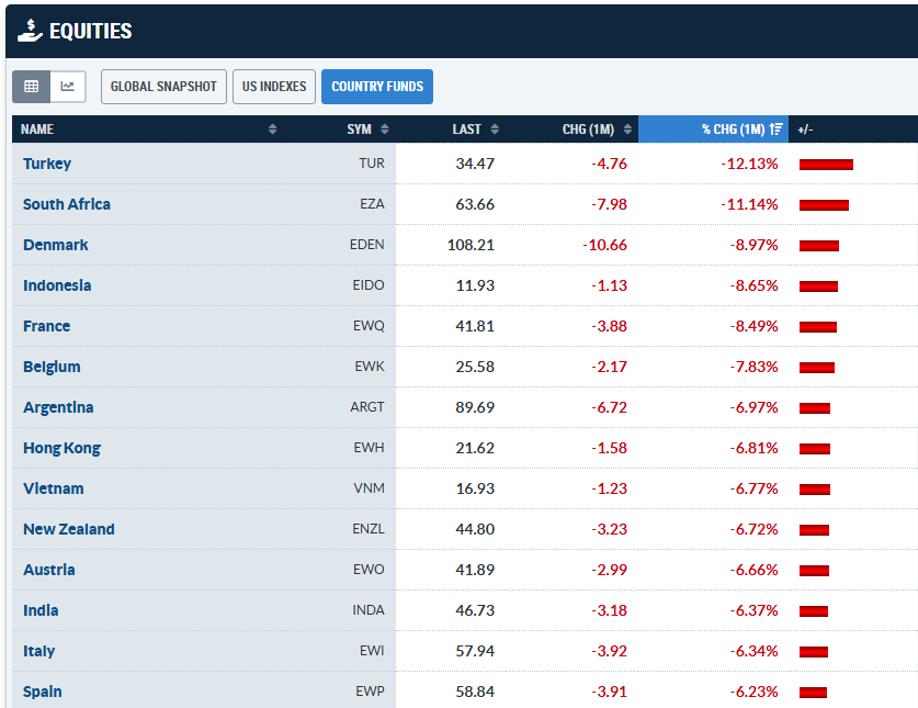
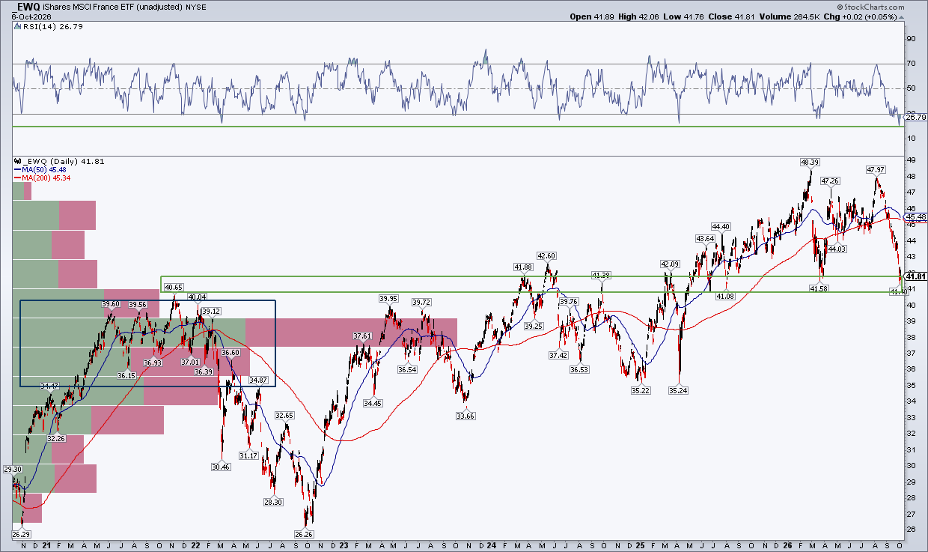
With the worst country ETFs up top, more than a handful of European nations appear. France is among them. Now in a 14% drawdown, the iShares MSCI France ETF (EWQ) chart screams, "Oh, mon dieu!"
But is there a buy-the-dip opportunity amid all the bearish fiscal headlines? The $40 to $42 range has been a polarity point throughout the 2020s. Almost unchanged on a price-only basis back to before the 2022 bear market, EWQ is at clear support. It comes as the RSI notches its most oversold level since March 2020. A weak RSI and a certain moving-average death cross are not sanguine signs, but they may indicate at least a near-term bounce is in order. A rally to $45 is possible but, if EWQ closes the week below $40, a trip to $35 could be the next stop.
The Bottom Line
Small caps and international stocks now lag the S&P 500 YTD. The crossovers occurred on the same day as the S&P 500's first record high since August. U.S. Treasury yields are pressing higher, the U.S. dollar is ripping, and breadth worries are tempering the bulls' enthusiasm. IWM and key European markets are at technical crossroads worth watching for possible October surprises.
Disclaimer: This blog is for educational purposes only and should not be construed as financial advice. The ideas and strategies should never be used without first assessing your own personal and financial situation, or without consulting a financial professional.