Three White Soldiers: The Bullish Signal Flashing Across Markets

Key Takeaways
- A key candlestick pattern marked the October 2011 low in stocks prior to a massive 15-year run for U.S. large caps.
- Similar bullish candlestick patterns are now appearing in Treasuries, semiconductor stocks, and the U.S. dollar.
- The signals aren't perfect, but their alignment across asset classes offers a notable clue as earnings season and the midterms approach.
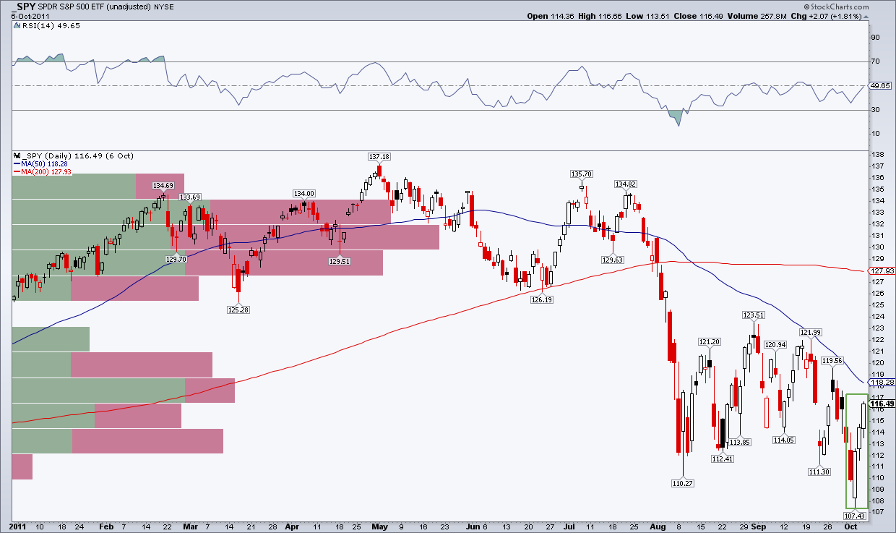
March 2009 gets all the glory, but October 2011 was a heck of a time to load up on stocks. Fifteen years ago, the S&P 500 ($SPX) endured a 21% peak-to-trough pullback amid the U.S. debt downgrade in August 2011 and the European debt crisis. The S&P 500 bottomed at 1075 on October 4. Returns since then have obviously been gaudy.
Total return, U.S. large caps are up 809% (turning $10,000 into $90,912), with incredible gains in the Nasdaq 100 ETF (QQQ), to the tune of 1569% (a 20.6% compound annual growth rate). Small caps (IWM), international equities (VEU), bonds (AGG), and cash (BIL) performed worse on down the line.
A Bullish Blast from the Past
But today's missive isn't a history lesson. It's a reminder of how powerful a single indicator can be. A bullish three white soldiers formation developed at the October 2011 low. It's a candlestick pattern associated with explosive upside reversals. You can dig through the feature, along with dozens of other candlestick signals, in our StockCharts Candlestick Pattern Dictionary.
Timely enough, Karl Montevirgen profiled five of the most bullish candlestick structures just two weeks ago; be sure to give it a look. Here's the Reader's Digest version: A bullish three white soldiers candlestick pattern consists of three consecutive long white bodies. Each should open within the previous body, and the close should be near the high of the day.
The Pattern Is Back
In the here and now, white soldiers are lining up across asset classes, with Q4 now well underway. Let's spot them, analyze the context, and determine the broader signal with earnings season on tap, a Fed meeting in the offing, and the midterms four weeks out.
Technicians know the old rule of thumb: bonds first, then stocks, then commodities. That's the general cadence to tops and bottoms across asset groups. So let's begin with Treasuries.
Spawning a Rates Melt-Up
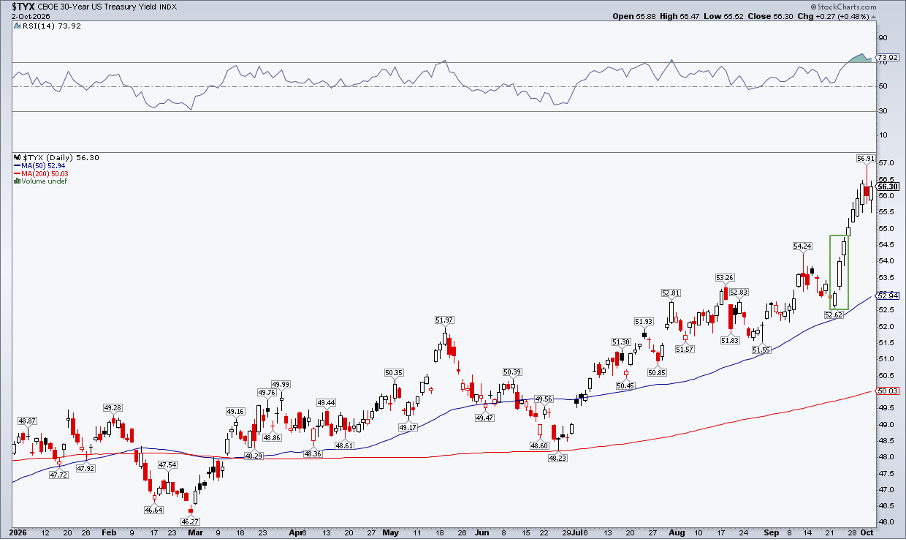
The first bullish three white soldiers pattern I came across was in the 30-Year US Treasury Yield ($TYX). Unfortunately, this one might have already run its course. Following a general uptrend since last October, the long bond rate began to surge on the first day of autumn 2026. From September 22 to last Thursday's peak, $TYX added 43 basis points.
The initial run-up was a bullish three white soldiers. It wasn't a reversal, of course, so it didn't fit the technical definition. Still, the yield advance marked the beginning of a string of sessions in which the 30-year traded up intraday. We'll see if the turn-of-the-quarter yield melt-up turns out to be some kind of blow-off top.
Chips Flash a Stronger Signal
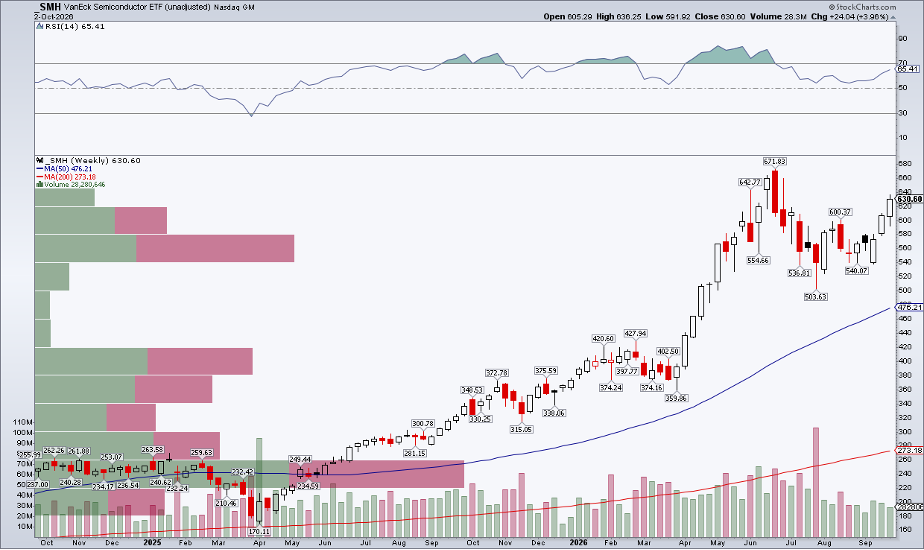
Now let's move on to stocks; this one is more timely. The weekly SharpChart of the VanEck Semiconductor ETF (SMH) reveals a classic bullish three white soldiers. Recall that chip stocks indeed had a Q2 melt-up, rallying from $360 on SMH to above $670 over 12 weeks. These AI-direct plays then cratered from the first day of summer to the Situational Awareness low in late July.
Shares whipsawed with high volatility thereafter, but the past three weeks were bullish. SMH opened on the low of the week, traded higher, and then closed each Friday near the week's high. The presumption is that an upside reversal is confirmed by the bullish three white soldiers, and new all-time highs are likely by year-end, in my view. SMH is on my bullish watch list, along with small caps, in 2026's home stretch.
The Dollar Soldiers Fall In Line
As for commodities, I don't have an exact comparable technical feature. In currency land, though, there are interesting developments.
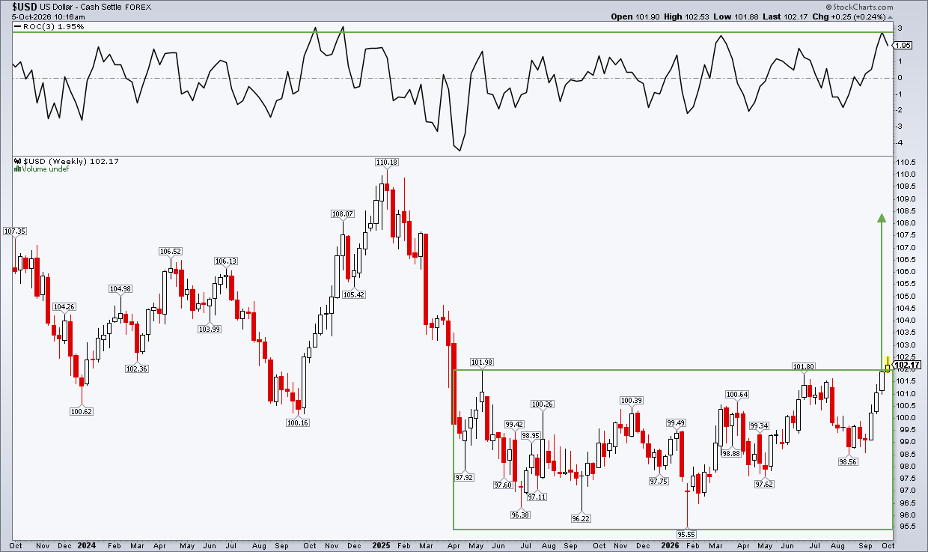
The US Dollar – Cash Settle ($USD) printed three white soldiers on the weekly chart coming into the first full week of October. The greenback tagged its best mark since April 2025 to kick off the data-light week. The $EURUSD currency pair, meanwhile, sank to near $1.12, its weakest level back to May of last year. $USDJPY has been conspicuously quiet.
Focusing on the $USD, this candlestick formation is once again not a tried-and-true bullish reversal, but it’s a clean upswing after a year-and-a-half of churn. What's more, the dollar just put in its best three-week rally since November 2024. The measured move upside target, based on the height of the April 2025 to September 2026 consolidation, is 108.50.
Candlesticks In Context
To be clear, there are no perfect indicators. The bullish three white soldiers is but one of dozens of well-known candlestick patterns that are easy on the eye and allow traders to spot reversals, no matter the time frame. That's what makes candlestick charting appealing, as the shapes, alignment, and names stand out more than typical line-chart or OHLC-chart indicators. I recommend traders use the candlestick chart type as their default.
The Bottom Line
It has been an incredible 15-year bull run for U.S. large caps. It all began with a bullish three white soldiers candlestick pattern in October 2011. Today, we see similar structures across asset classes, each telling its own story. The 30-year yield's steep rally started with a three-soldier pattern, SMH's weekly chart shows the hallmark of a bullish reversal, and the dollar may be on the verge of confirming its own breakout. Candlesticks offer insight into the anatomy of a price thrust, and traders should take the signal from these trends.
Disclaimer: This blog is for educational purposes only and should not be construed as financial advice. The ideas and strategies should never be used without first assessing your own personal and financial situation, or without consulting a financial professional.