Can Market Breadth Help Identify S&P 500 Turning Points?

In this post, I would like to share an interesting study by Cedric Thompson, CMT, CFA, in which he evaluates whether changes in market breadth can help identify turning points in the stock market.
Julius: Cedric, you’re a student of technical & quantitative analysis. What sparked your interest in the subject?
Cedric: My approach to the markets has been shaped by the daily wisdom shared on StockCharts.com. By religiously following contributors such as you, Dave Keller, Tom Bowley, and Mary Ellen McGonagle, I was inspired to look beyond simple price action and develop my own robust trading and investing frameworks.
For me, the game changed with the advent of Large Language Models (LLMs). These tools helped me bridge the gap between idea generation and strategy execution, which allowed me to build sophisticated scripts and backtest environments. That technological leap enabled me to develop quantifiable signals for market entries, exits, pullbacks, and capitulations that were previously the domain of institutional quant desks.
In the article below, Cedric walks us through his analysis of an important market breadth indicator.
Using the Bullish Percent Index (BPSPX) for High-Probability Trading Signals
One specific indicator I wanted to deconstruct was the S&P Bullish Percent Index ($BPSPX). After reaching out directly to Dave Keller and Julius de Kempenaer, I was able to attain 30 years of historical market breadth data. By comparing this data against the S&P 500 ($SPX) price moves, I have developed a probabilistic signal framework designed to identify high-conviction turning points.
Understanding the Internal Engine
Just to provide some context, the S&P 500 is a cap-weighted index. This means the health of the headline index often masks rot beneath the surface. Market breadth measures the participation of the individual components. The BPSPX is unique because it is based on Point & Figure (P&F) charting, which focuses purely on price reversals and ignores time.
Binary Health: A stock is either on a P&F buy signal or it isn't.
Noise Filter: By requiring a specific reversal distance, it ignores the daily choppiness that often triggers false signals in moving averages.
The Formula:

30-Year Probabilistic Signal Analysis
Using my custom scripts, I utilized 4 critical transition points in the BPSPX and tracked the subsequent performance of the S&P 500 over timeframes ranging from 5 days to 12 months.
Signal Performance Summary
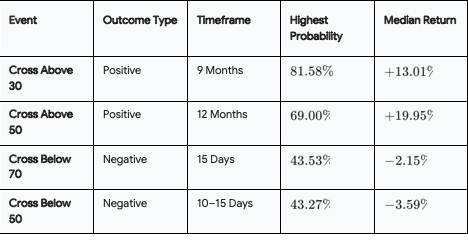
The Bullish Case: The Power of Recovery
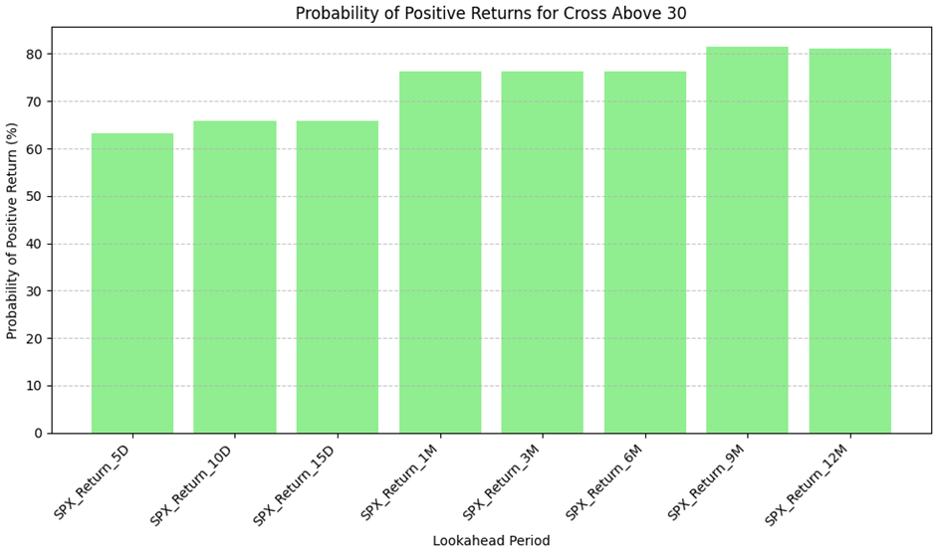
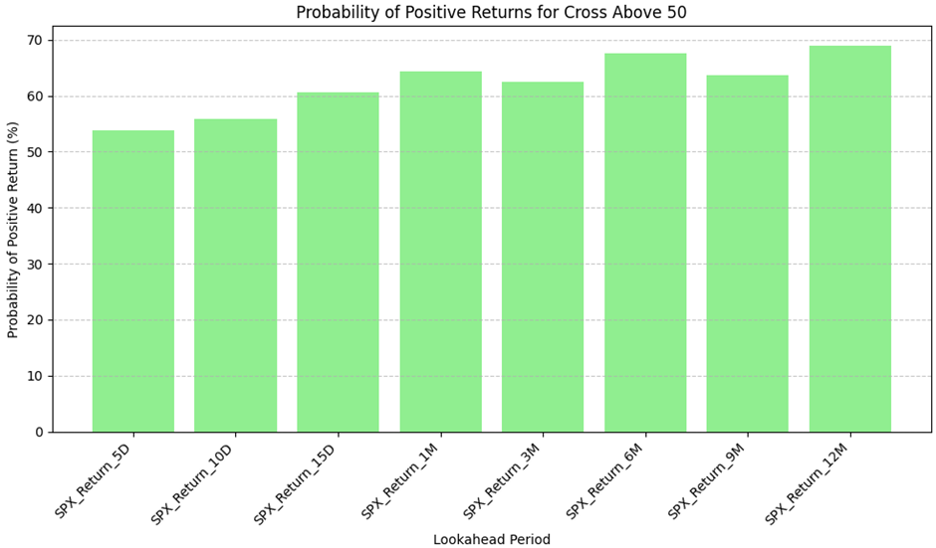
The data suggests that breadth recoveries from washed-out conditions (crossing above 30) are more reliable than momentum signals (crossing above 50). While the Cross Above 50 offers a slightly higher median return at the 12-month mark, the Cross Above 30 offers significantly more consistency.
Top Ranked Bullish Signals:
- Cross Above 50 (12M): 19.95% Median Return (69% Probability)
- Cross Above 30 (12M): 19.71% Median Return (81.08% Probability)
- Cross Above 30 (9M): 13.01% Median Return (81.58% Probability)
The Bearish Case: Identifying Material Rot
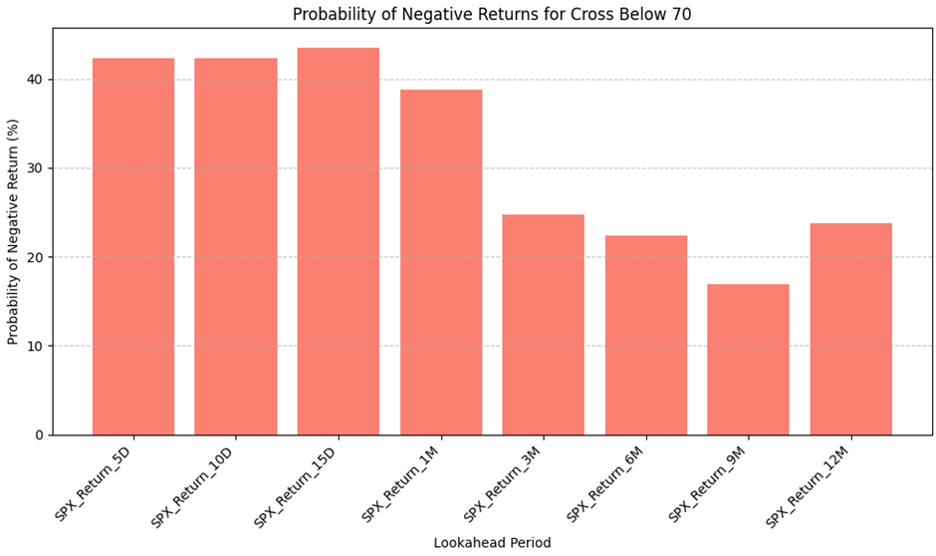
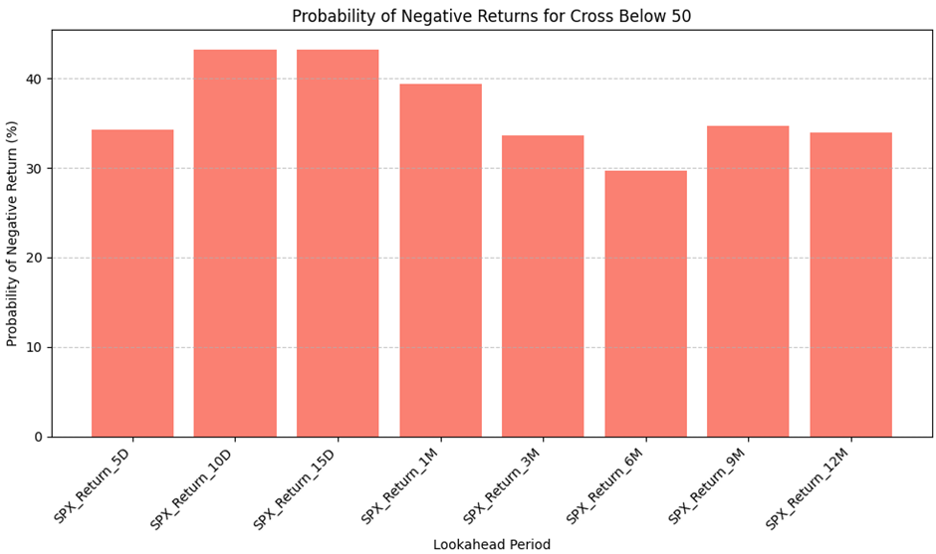
Bearish signals are generally less predictable in terms of pure probability (hitting less than 50% of the time for negative returns), but the magnitude of the moves is critical.
A move below 70 is often just a bit of cooling off. However, once the BPSPX breaks the 50 level, the probability of a deep drawdown increases significantly. The median 12-month return following a cross below 50 is -14.01%, suggesting that, once the average stock loses its buy signal, the cap-weighted index eventually feels the gravity.
Top Ranked Bearish Signals (by Median Negative Return):
- Cross Below 50 (12M): -14.01%
- Cross Below 50 (9M): -11.49%
- Cross Below 70 (9M): -10.36%
Signal Generated in Early April
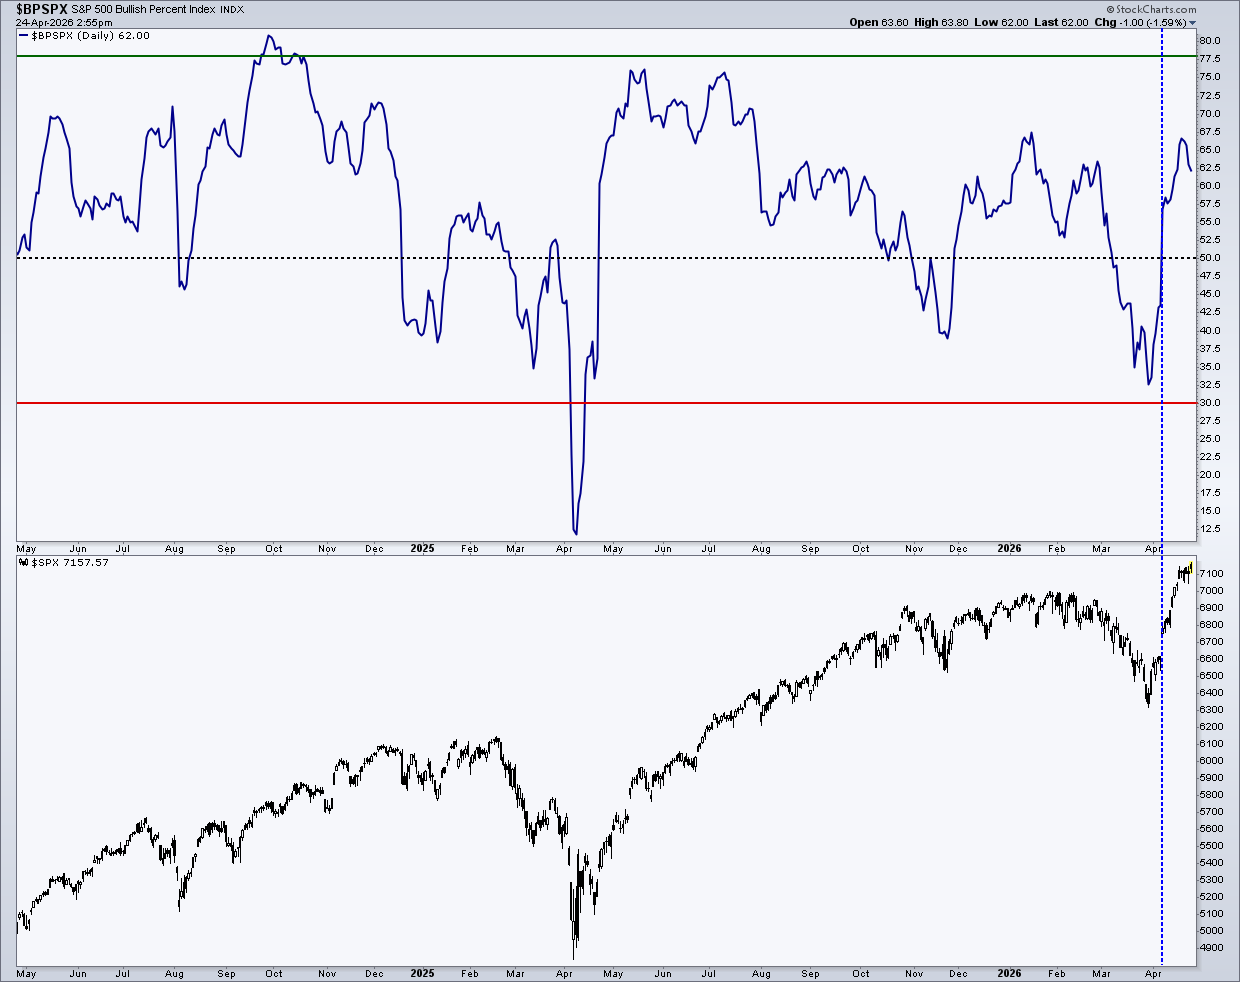
We are seeing this framework play out in real-time. On the close of April 8th, 2026, the BPSPX officially triggered a "Cross Above 50" signal.
Early price action has already validated the move, with the S&P 500 climbing over 5% since the crossover. However, the true value of this signal lies in the long-term projection. Based on our 30-year data set, this specific "Cross Above 50" event carries a 69% probability of delivering a median return of approximately 20% over a 12-month horizon.
While the market rarely moves in a straight line, this historical precedence suggests that the current expansion of breadth is not just a short-term fluke, but the potential foundation for a sustained trending environment through early 2027.
A Framework for Strategic Patience
Through the combination of mentor-inspired theory and LLM-assisted data science, the BPSPX emerges as a vital component of a modern trading framework. It teaches us that a certain level of patience is a quantitative edge. The most reliable signals (BPSPX > 30) take months to fully play out. By using this indicator to assess whether market internals are actually improving, regardless of what the Magnificent 7 are doing to the headline price, we can position ourselves with the wind at our backs.
This framework doesn't just tell us what the market is doing today; it tells us what the market is capable of doing over the next year.
LinkedIn: linkedin.com/in/cedric-thompson-cmt-cfa-mba
Instagram: ceddy8600
X: @ceddy86
Youtube: @cedricthompson632