The August Test: Can the Bull Market Survive Seasonal Volatility?
Key Takeaways
- Stocks enter a historically uneasy late summer after three months of range-bound trading, with the July jobs report likely to set the near-term market tone.
- Small-caps, bonds, and the U.S. dollar are flashing mixed technical signals, pointing to elevated cross-asset uncertainty.
- While market breadth and earnings remain supportive, seasonal headwinds suggest a measured, risk-aware approach may be warranted.
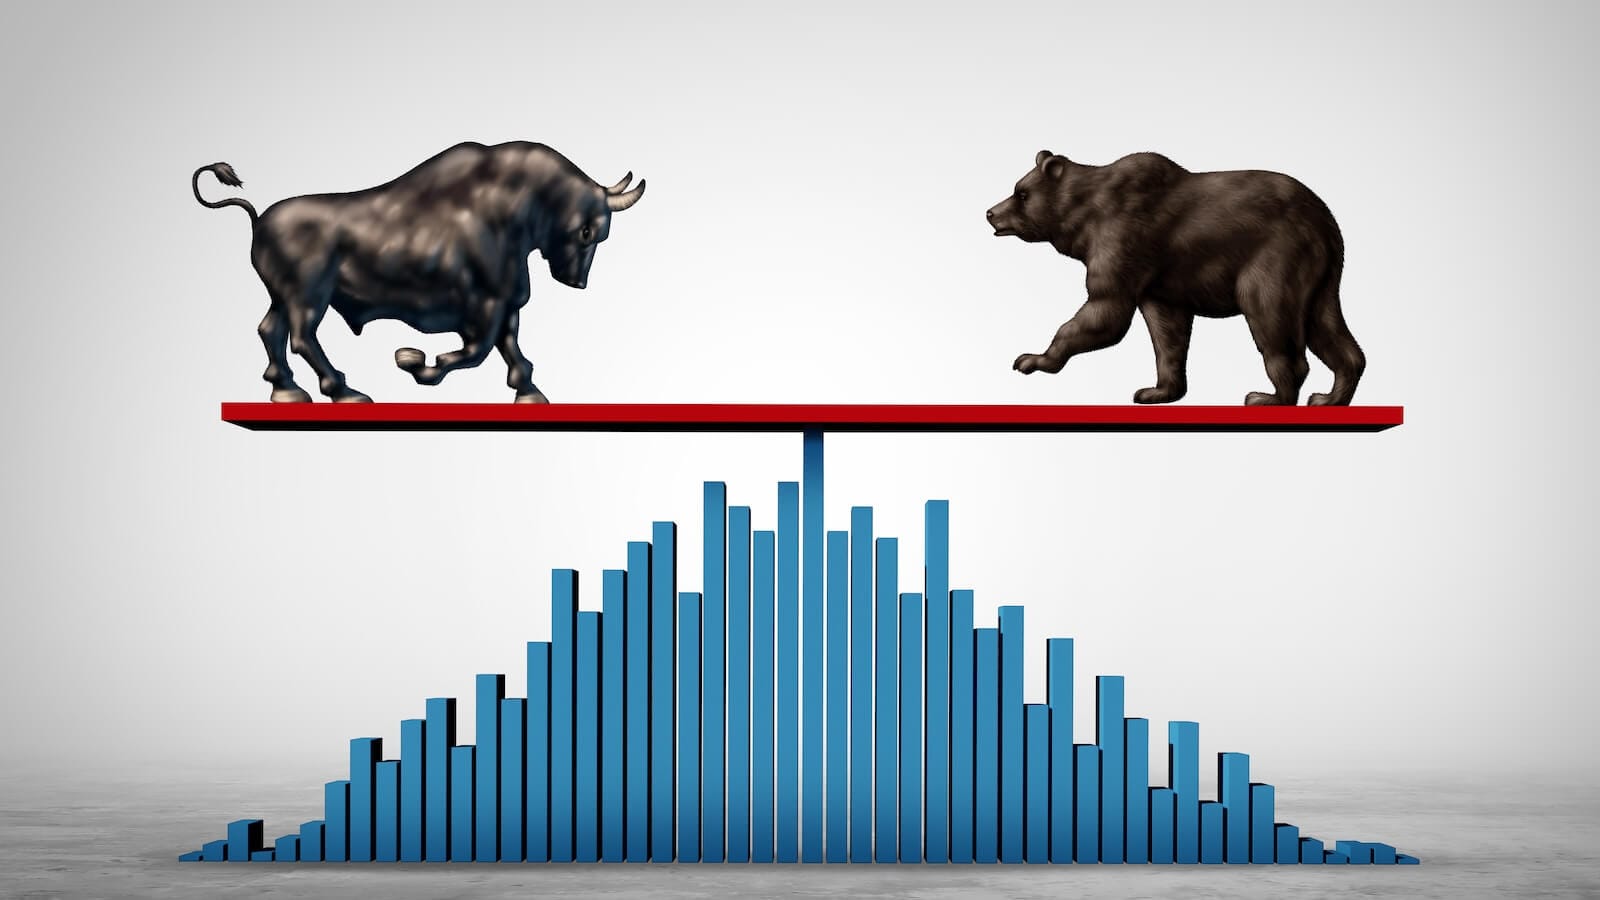
The S&P 500 posted back-to-back losing months in June and July. It was a light shade of red, though, with US large-caps slipping just 1.06% and 0.13%, respectively, around the mid-year turn. Equities now face the real seasonal exam. Historically, August and September challenge the bulls with volatility and pop-up worries.
Just a year ago, a weak July jobs report spooked the Street and the White House. President Trump announced his intention to fire the head of the Bureau of Labor Statistics. Political theater aside, a then-softening labor market prompted the Powell-led Fed to resume cutting its policy rate. Step back in time two years, and a swift yen-carry trade unwind sparked intense cross-asset volatility (followed, again, by Fed easing).
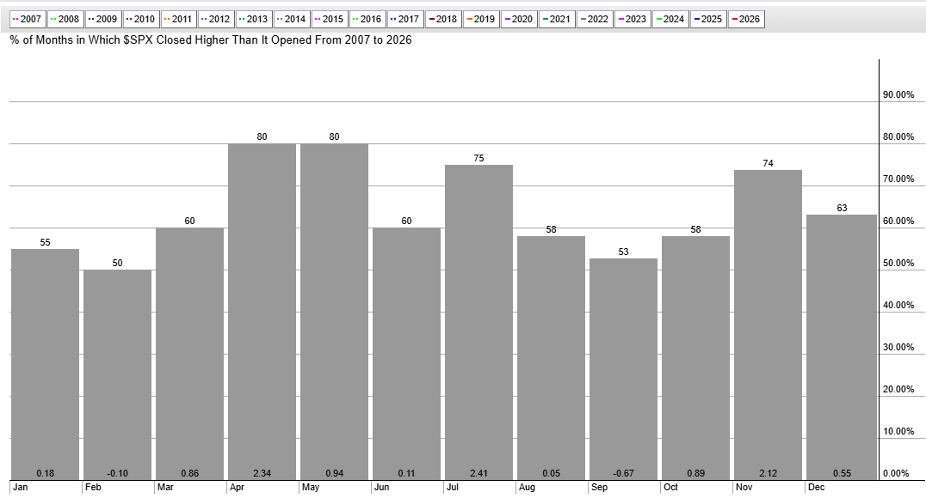
Watch Reactions to July Jobs
This week may set the tone. All the usual jobs data hits the tape, culminating with the July payrolls report Friday morning. Economists aren't expecting fireworks, but there could still be residual World Cup one-offs embedded in the establishment and household surveys.
Across the economy's body of work this summer, conditions appear firm enough. Oil prices took another leg lower to kick off August, corporate earnings growth is through the roof (albeit from intense AI investment and "other income" on mega-cap tech profit statements), and stock market breadth is downright impressive.
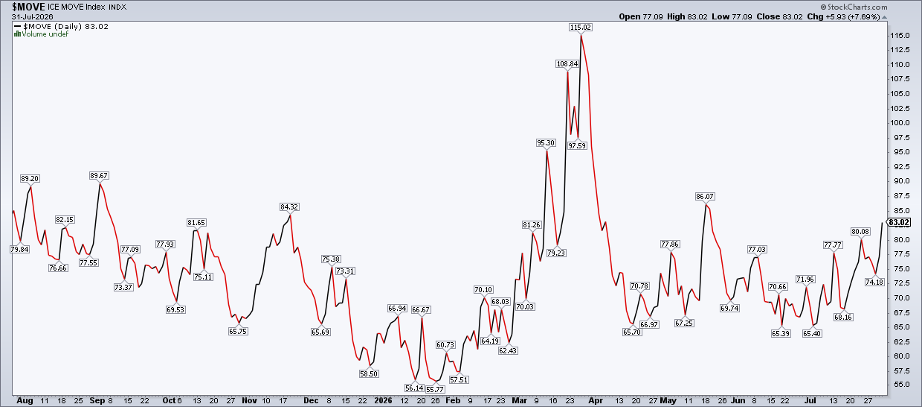
The bears can point to weakening CCC credit spreads and, of course, bond market selling pressure. Indeed, the global yield path of least resistance is higher, particularly following last week's FOMC meeting and Warsh's presser, which was best described as "evasive." Rates are off the boil on the first trading day of the month, however, much to the delight of risk assets. Still, the ICE BofA MOVE Index ($MOVE) of interest rate volatility nudged up to its highest mark since May, suggesting some sovereign angst.
The Dollar’s Surprising Reversal
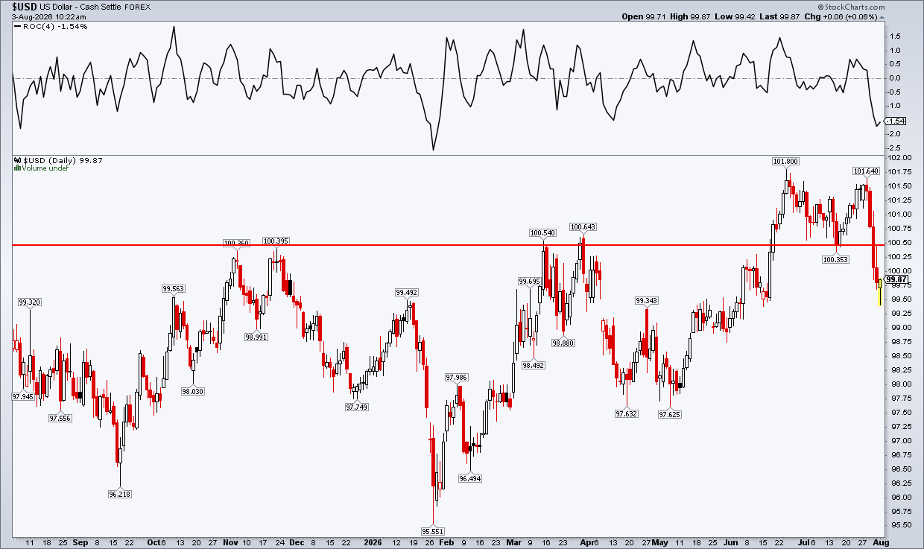
Technicians always think in terms of "stocks, bonds, commodities, and currencies" when performing asset class check-ups. That last category surprised traders to close out July. The US Dollar Index ($USD) appeared to be full throttle to the upside at 2026's halfway point. A sudden breakdown last week (down 1.6% over four days) took the greenback back below the key 100.3-to-100.6 range.
Blame it on a wishy-washy Warsh, along with Japanese policymaker intervention in USDJPY. The USD fell to 99.42 on Monday before bouncing back, courtesy of a USDJPY bounce. FX will be a macro area to monitor now through the fall, in my view.
Small Caps Lost Their Summer Mojo
Zooming in on equities, one weekly chart grabbed my attention as July's dust settled. The Russell 2000 ETF (IWM) narrowly avoided a fifth straight down week. Still, amid the market's ups and downs since the summer began, US small-caps have been on a slow grind lower. IWM peaked on July 1 at $302.72, gradually easing to $288 after the July 29 Fed meeting reaction. The daily chart reveals a few interesting features that may put the bears in control over the near term.
Notice in the SharpChart below that IWM sports a bull flag pattern. "Bull" flag... how can that be bearish? Well, the longer the flags extend, the more questionable the continuation pattern becomes. Generally, we want to see tight flags, followed by decisive breakouts. Small caps now straddle the flattening 50-day moving average, which is another sign of wobbly near-term trends.
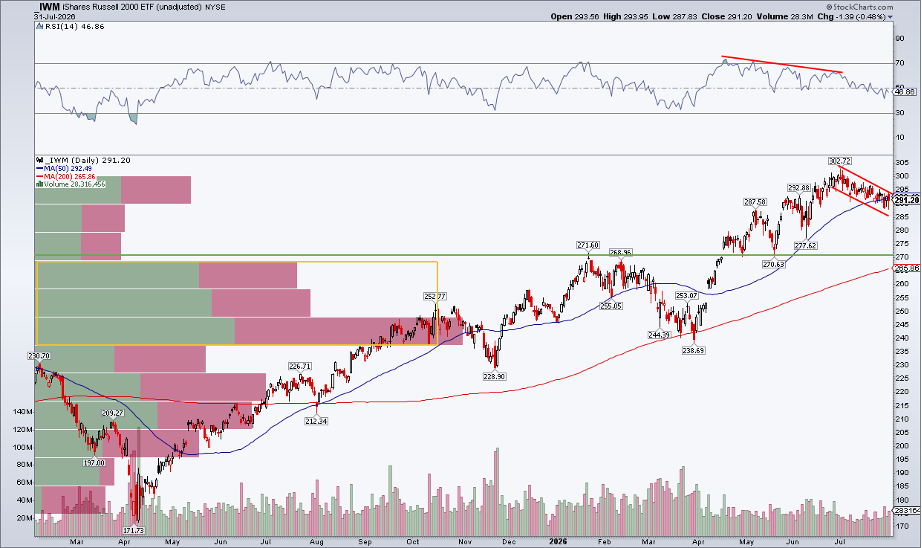
Also, look at the RSI momentum oscillator at the top of the chart. It shows modest negative divergence to price, with lower RSI highs as price scaled new peaks in May and June. The broadening trade was working, but then cooled off after the Russell index reconstitutions in late June. The RSI's range remains healthy, above 40, so this is not a screaming-sell situation.
What's more, long-term support is likely near $270. That was the pre-war peak in January and where buyers stepped up in May. The long-term 200-day moving average will soon enter the picture close to $270, too. Traders know that I am a fan of the volume-by-price indicator, and that points to clear congestion (which is support, in this case) starting at $270. In short, IWM's consolidation confirms the S&P 500's churn. Both indices have gone nowhere for almost three months now.
A Global Holding Pattern
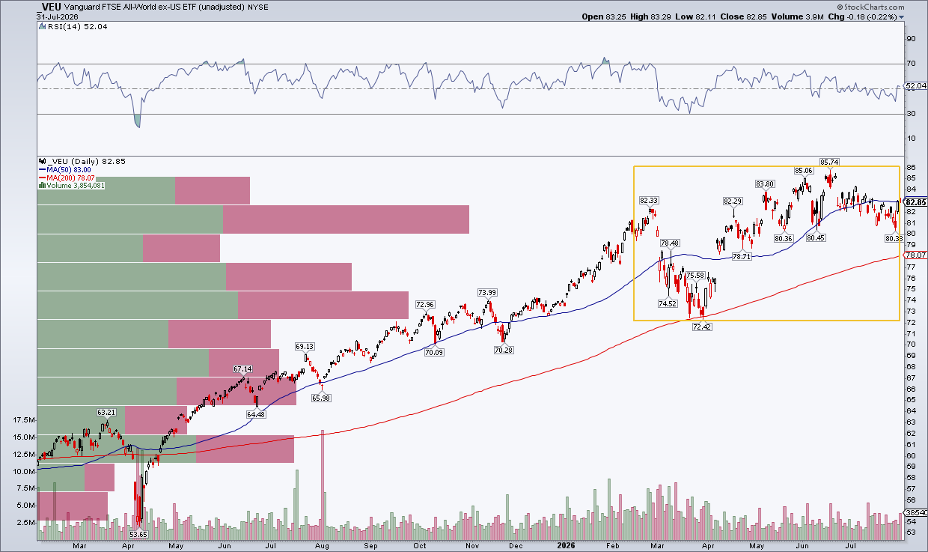
Globally, sideways chop best describes the Vanguard FTSE All-World ex-US ETF (VEU) as well. International equities have been unchanged since late February. The lack of trend leaves technicians wondering if these are pauses in the trend of a larger degree (higher) or a more sinister distribution.
We'll likely get our answer between now and mid-October (a period when volatility tends to amplify). For now, it's a wait-and-see approach, so keeping some dry powder might be the prudent play.
The Bottom Line
June and July favored neither the bulls nor the bears. US large and small caps are range-bound as we head into a dicey calendar stretch. Cross-asset trends include ongoing fixed-income weakness, oil that seems to make a lower high with each passing rally, and a possible dollar failed breakout.
While there are pockets of strength (S&P 500 equal weight, value, and maybe even China), a measured risk stance may be appropriate over the next couple of months.
Don't wait for seasonal trends to surprise you. Use Seasonality Charts to anticipate recurring market patterns and position yourself with confidence.
Disclaimer: This blog is for educational purposes only and should not be construed as financial advice. The ideas and strategies should never be used without first assessing your own personal and financial situation, or without consulting a financial professional.