New SharpCharts Indicator Settings + My Horizontal Line Trick
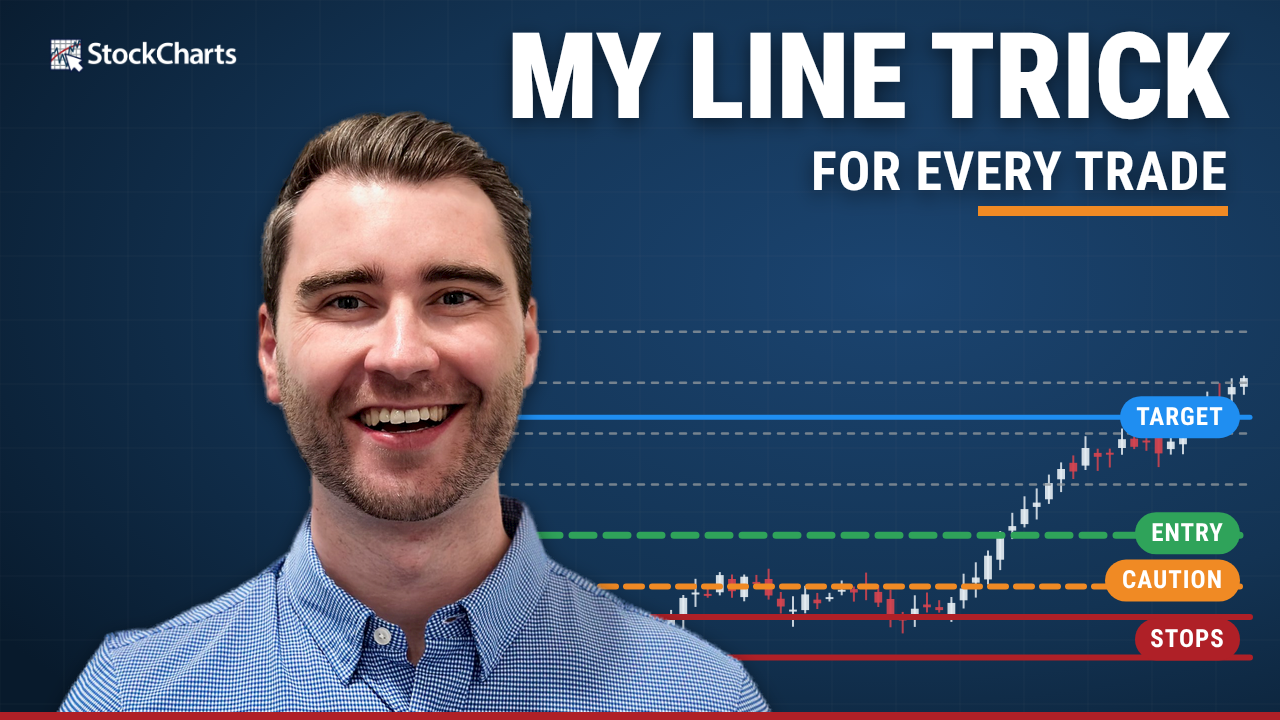
Why does Grayson Roze have so many horizontal lines on his charts? He uses them to map every trade: entry, stops, a "caution" level, targets and gain levels, all color-coded right on the chart.
In this video, StockCharts Chief Strategist Grayson Roze tours the latest SharpCharts Workbench upgrades, then shares the horizontal line system he has used for years. Together, you'll explore:
- How to turn on High Definition charts for sharper lines and labels.
- How to pin the Workbench drawer so your settings sit right below your chart.
- The new indicator settings dialogue: color zones for RSI, clearly labeled MACD inputs, and a much easier setup for Pring's Know Sure Thing (KST).
- How to drag and drop to reorder indicators and overlays.
- Grayson's horizontal line system for trade setups: green for entry, red for bracketed stops, orange for "caution".
- How he adapts lines for open positions, including gray 5% gain levels and blue add/target levels.
See everything new on StockCharts!
This video originally premiered on November 3, 2026. Watch it on this page or on our dedicated Grayson Roze page on StockCharts TV. You can view previously recorded videos from Grayson at this link.
Note: The AbbVie (ABBV) trade in this video is a hypothetical example for demonstration only, not a recommendation.