Mixed Performance Weighs on the MAG7 ETF as it Hits Moment of Truth; Apple Pulls Back

Key Takeaways
- The Mag 7 stocks have been displaying mixed performance, which is weighing on the Mag7 ETF (MAGS).
- MAGS is hitting the moment of truth with a return to breakout.
- Apple has corrected after a breakout surge.
The Mag7 ETF is slightly lagging the broader market because of relative weakness in three components. Nevertheless, four components are showing strength, and the ETF hit a moment of truth as it returned to the breakout zone. Today's report will focus on performance for stocks in the Mag7, the Mag7 ETF chart, and one of the leading components (Apple).
This report continues at TrendInvestorPro with analysis of the other three leaders, Nvidia, Amazon, and Alphabet. These three are hitting Bullish Setup Zones after becoming short-term oversold. This report also includes a video.
Leaders and Laggards Within MAGS
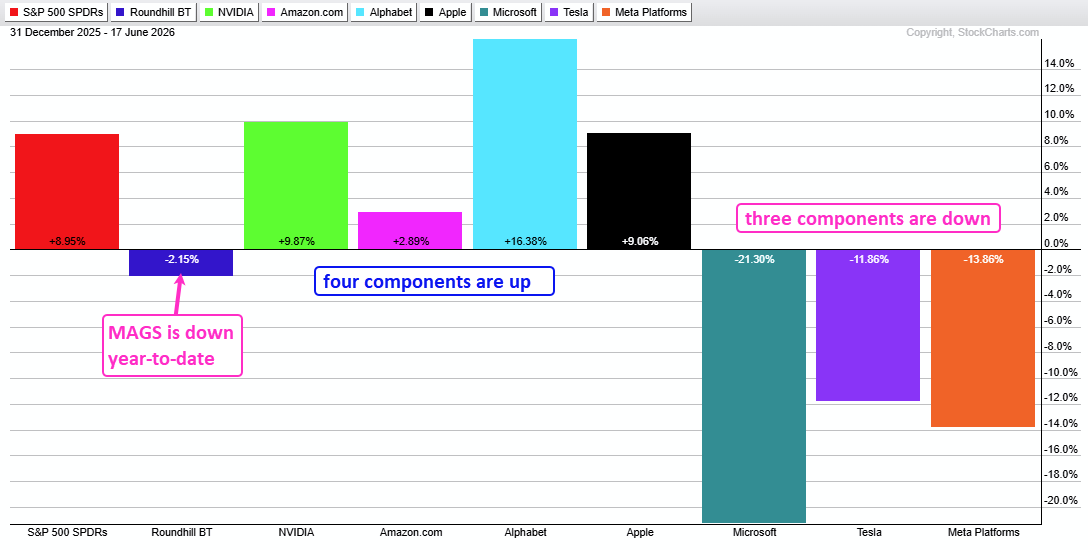
The PerfChart below shows year-to-date performance for the Mag7 stocks. SPY is up year-to-date, but MAGS is down around 2%. Four components are up, with NVIDIA (NVDA) and Alphabet (GOOGL) leading the way. Microsoft (MSFT), Tesla (TSLA), and Meta (META) are weighing with double-digit declines in 2026.
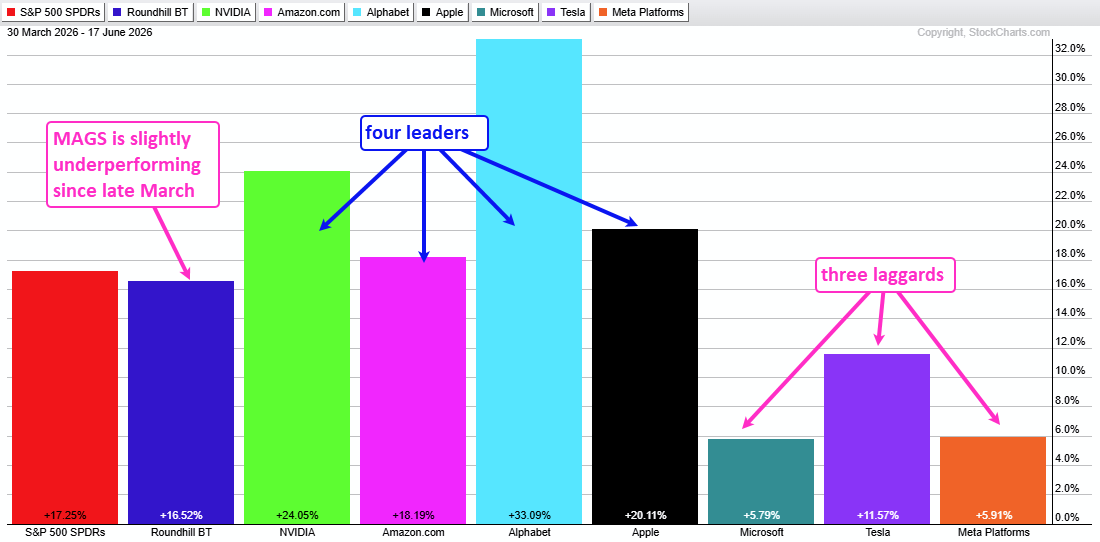
The next chart shows performance since the late March low. MAGS is up 16.52%, and slightly lagging SPY (+17.25%). Again, we can see the same leaders and laggards. NVDA, AMZN, GOOGL, and AAPL are outperforming with strong gains, while MSFT, TSLA, and META are lagging with smaller gains.
These performance charts show that the Mag7 stocks are not one homogeneous group. They don't move in the same direction and are not positively correlated. These performance differentials could make it difficult for MAGS to develop a sustained trend.
MAGS Hits Moment of Truth
The next chart shows the Mag7 ETF (MAGS) with the 200-day simple moving average (SMA) and price-relative (MAGS/RSP ratio). MAGS broke out in April and surged to new highs in May. It tested these highs in early June, then fell back to the 200-day SMA.
The blue shading marks the moment of truth for MAGS. A normal correction should end in this area and reverse (blue shading). Here, we have the rising 200-day SMA, the 50% retracement, and broken resistance which turns into support. A return to the 200-day and the breakout is normal for a correction, while a 50% retracement represents one step backwards after two steps forward.
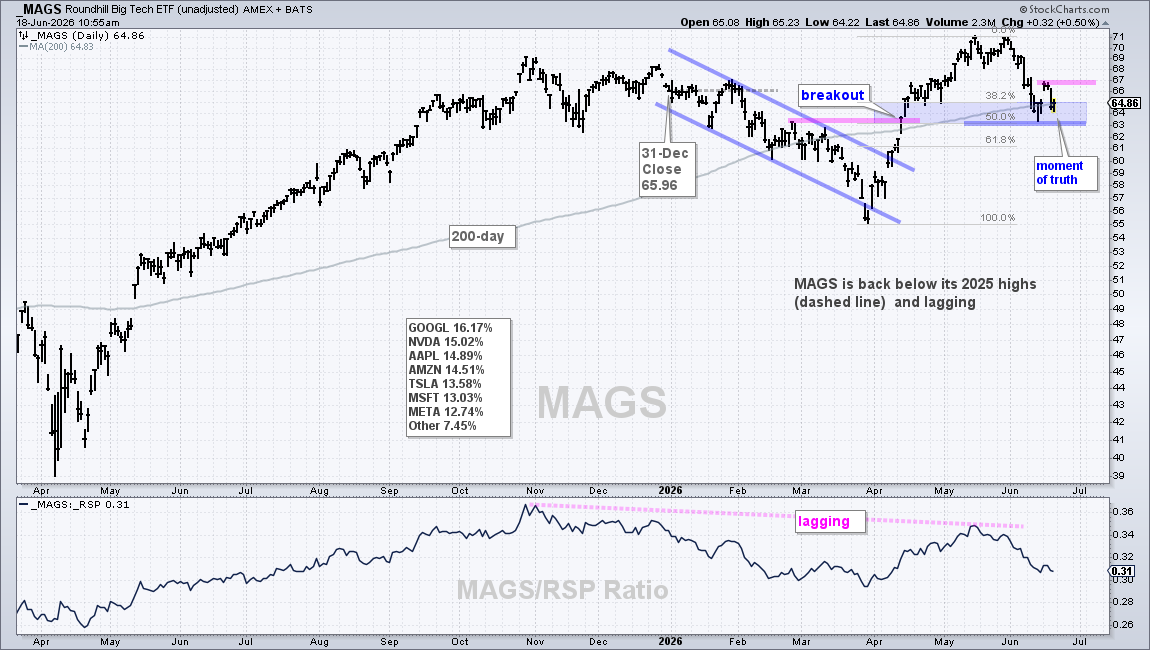
MAGS bounced off this level with a gap on Monday and then fell back. This pop-and-drop established a short-term resistance level to watch for follow through. A move above 67 would show follow-through and trigger a short-term breakout.
Recent Reports and Videos on TrendInvestorPro
- Breakouts in Tech, Semis, AI, Industrials & Defense
- Biotech ETFs Set Up with Bullish Continuation Patterns
- Healthcare Extends on Breakout as Breadth Improves
- A Breadth Thrust for Utilities (plus Two Stocks)
- Copper and Base Metals Set Up as Copper Miners Breakout
Click here to subscribe and gain immediate access.
Apple Corrects after Breakout Surge
The next chart shows Apple (AAPL) advancing into early December, forming a triangle into April, and breaking out at the beginning of May. A triangle is a consolidation that takes its trading bias from the direction of the prior move, which was up. This makes it a bullish continuation pattern.
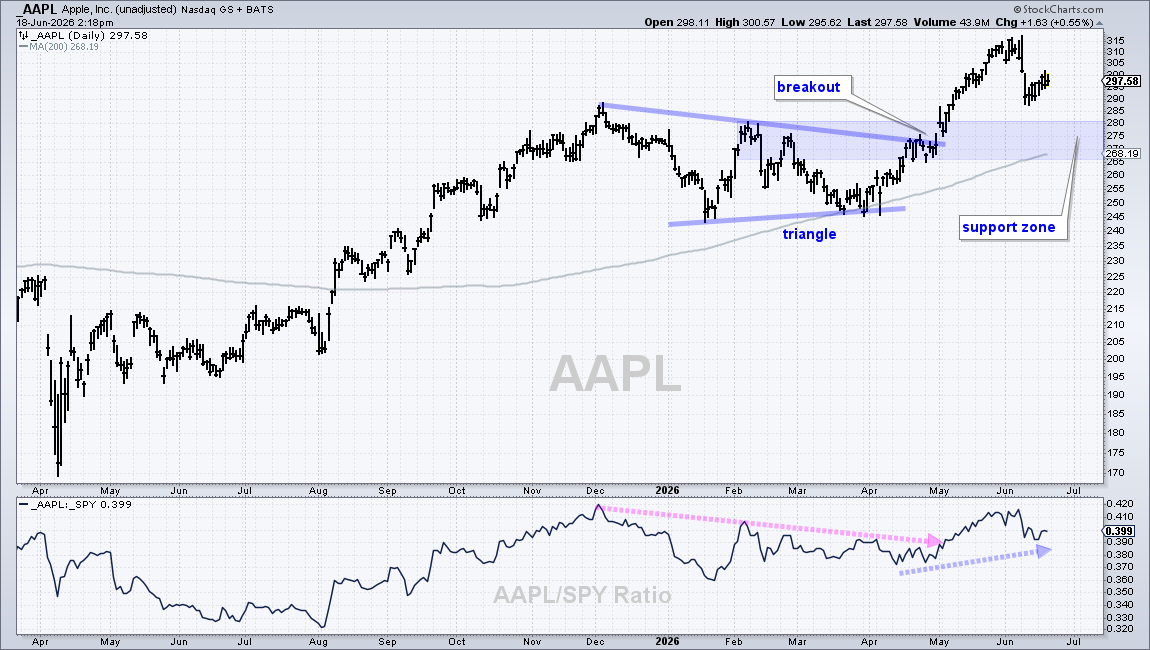
I don't see a setup in Apple right now. The breakout zone and rising 200-day SMA mark support in the 265–280 area. A correction into this zone may provide an opportunity.
The other three leaders are setting up as they correct within their uptrends.
The second part of this report (with video) continues on TrendInvestorPro (subscription). Note that TrendInvestorPro specializes in finding tradable pullbacks within leading uptrends.