Stocks Bounce Back After Warsh’s Hawkish Fed Debut: What the Charts Say Now
Key Takeaways
- Stocks recovered after the Fed selloff, with the S&P 500 and Nasdaq reclaiming their 21-day EMAs and moving back toward key resistance levels.
- Technology remains the market leader, with semiconductors driving momentum.
- Precious metals are under pressure, while oil prices are testing support of the 200-day moving average.
Investors got their first look at Kevin Warsh behind the podium as Chairman of the Federal Reserve. The Fed’s decision to leave interest rates unchanged didn’t come as a surprise but, with inflation running at 4.2% and a labor market still holding firm, Wall Street was listening closely to determine whether Warsh would lean hawkish or dovish.
Warsh’s comments, as interpreted by the market, leaned hawkish. There was also an emphasis on changes coming to the Fed’s communication style, including fewer press conferences. After the press conference, the market priced in a higher probability of an interest rate hike this year earlier than December. According to the CME FedWatch Tool, the market is now pricing in a 50% chance of an interest rate hike in September, as of this writing.
Stocks dropped after the Fed decision and press conference, while Treasury yields rose. By Wednesday’s close, all three major indexes were in the red.
But Thursday brought a rebound. The S&P 500 ($SPX) and Nasdaq Composite ($COMPQ) are back above their 21-day exponential moving averages (EMAs). Both indexes have clearly defined support and resistance levels that could determine the next directional move.
For the S&P 500, a break above 7578 would improve the odds of a run back toward its previous high, with the potential to push beyond it.
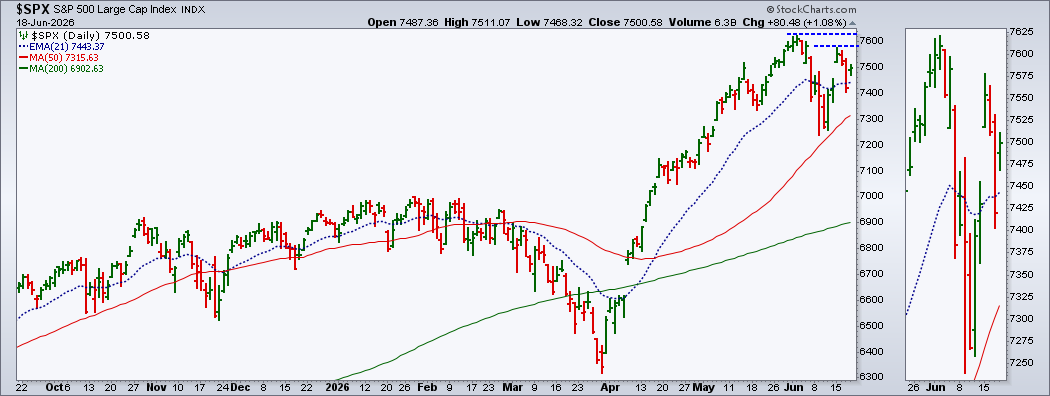
On the downside, a break below the 21-day EM could send the S&P 500 toward its 50-day simple moving average (SMA).
The Nasdaq is in a similar position. A breakout above 26730 could put the index on track to test its prior high and possibly extend further.
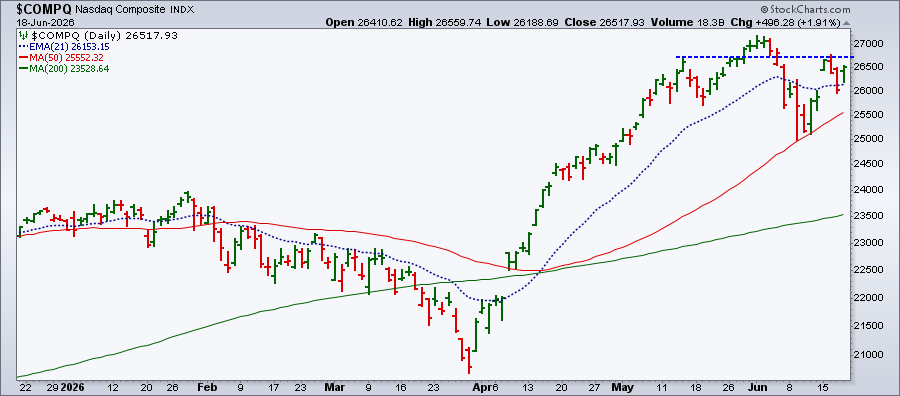
If the Nasdaq fails to hold its 21-day EMA, the next downside target would likely be to its 50-day SMA, which would be a key support level to watch.
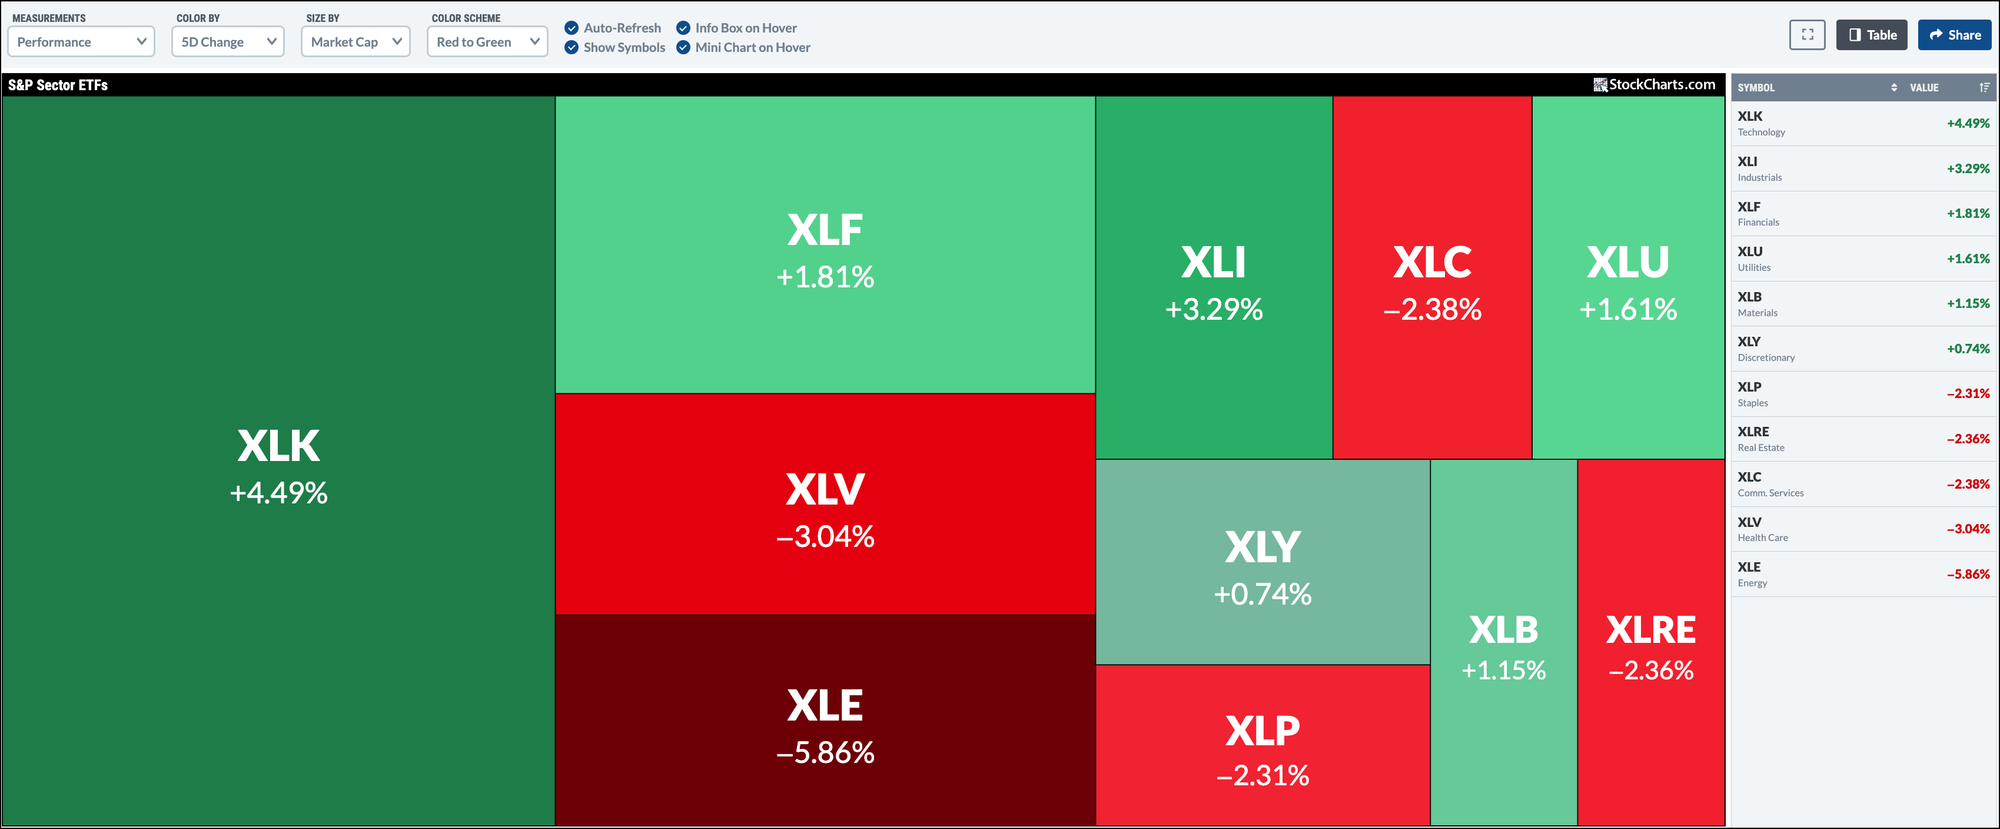
Tech Still Leads
If you follow Julius de Kempenaer’s blog posts, you already know that Technology is still the top-performing sector. The StockCharts MarketCarpet view of the five-day change in the S&P Sector ETFs confirms it. The Technology Select Sector SPDR (XLK) is leading the pack, rising 4.49% over the last five days.
Drilling deeper into Technology, semiconductors are leading the charge. The VanEck Semiconductor ETF (SMH) closed at an all-time high, putting the semiconductor and AI trade back in the spotlight.
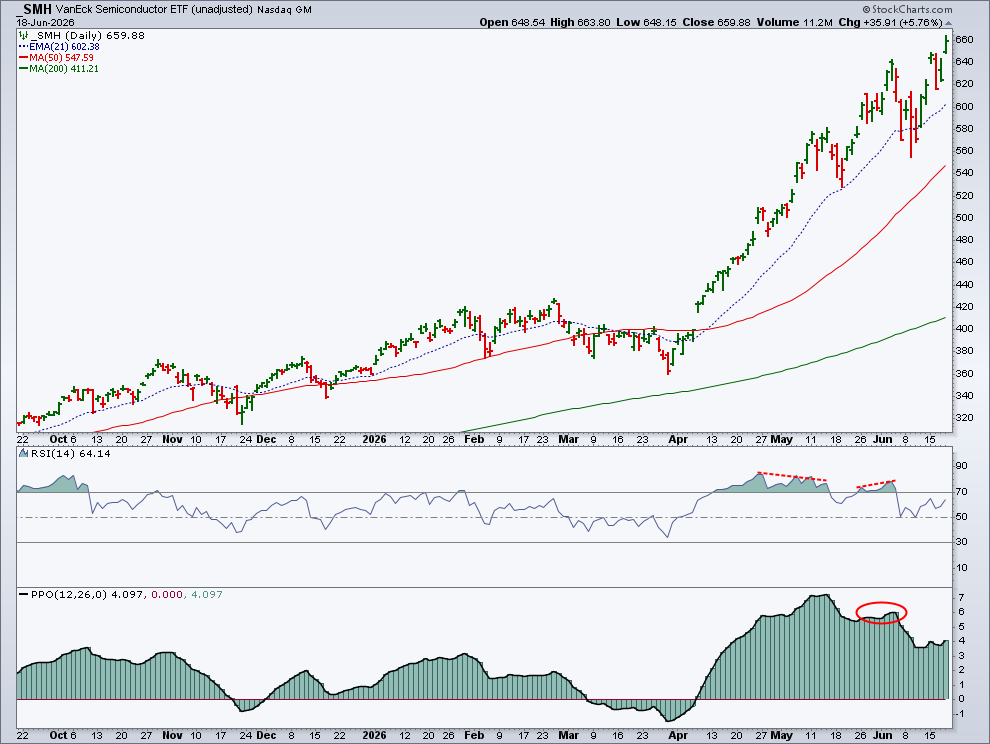
The Relative Strength Index (RSI) and Percentage Price Oscillator (PPO) aren't indicating strong momentum but if it picks up, don't be surprised to see this group rise further.
Oil Slides
Crude oil prices are moving lower following the signing of a memorandum of understanding between the U.S. and Iran. With ships beginning to move through the Strait of Hormuz again, oil prices have started to ease.
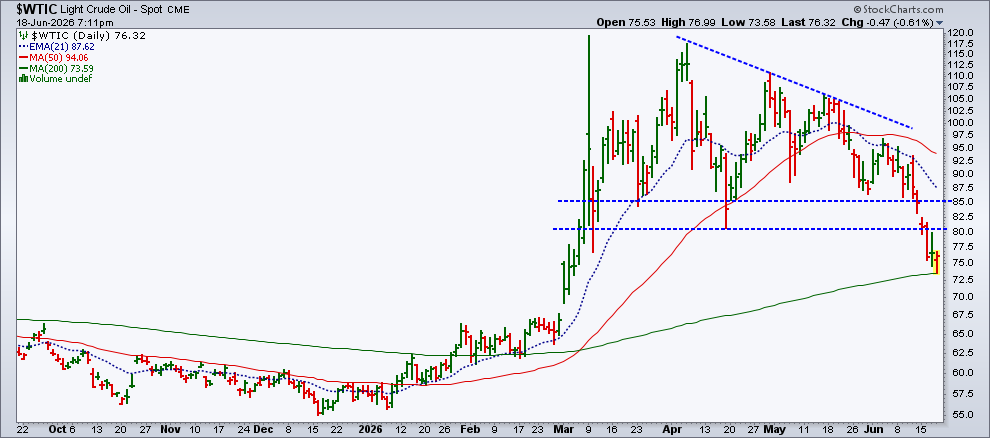
Light Crude Oil ($WTIC) is finding support at its 200-day SMA, while Brent Crude Oil ($BRENT) fell below its 200-day SMA, rebounded, and closed slightly above it. Both are trading at levels last seen in early March.
The daily chart of $WTIC shows a clean bounce off the 200-day SMA. If price breaks down below this moving average, oil could fall toward $69, the March 2 low. Below that, crude could start moving back to pre-war levels.
If oil prices continue to slide and inflation eases slightly, the Fed may have more reason to keep rates steady rather than move ahead with another hike.
U.S. Dollar Strengthens
The U.S. dollar, which has been trending higher since mid-May, extended its move after the Fed’s decision and Warsh’s comments. The weekly chart below shows the dollar has broken above its March/April highs.
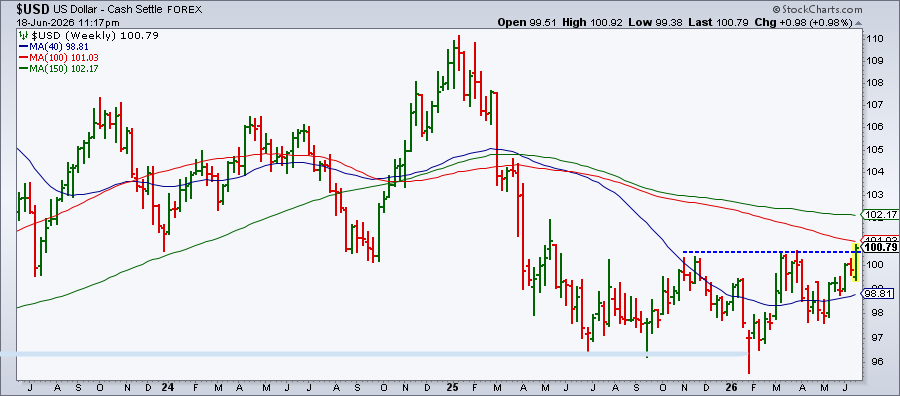
A stronger dollar puts pressure on precious metals.
Precious Metals Take a Hit
Gold and silver prices are trading below their 200-day SMAs while their 21-day EMA are trending lower. In gold’s case, the 21-day EMA is below the 200-day SMA. This points to clear short-term weakness in the metals charts.
The longer-term picture is also starting to look fragile. On the five-year weekly chart, $GOLD is trading below its 40-week SMA and approaching its 38.2% Fibonacci retracement level.
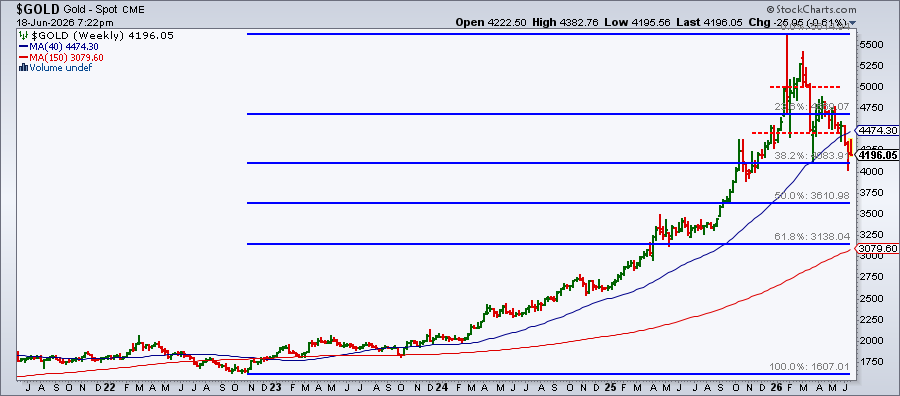
Clearly, this isn’t a bullish environment for gold. With the probability of rate cuts fading, Treasury yields are likely to remain firm or rise, making bonds more attractive to investors relative to gold.
The Bottom Line
Overall, equities remain in an uptrend. Gold is weakening, the U.S. dollar is strengthening, and oil prices are hanging on.
There isn’t much on next week’s calendar, except for the May Personal Consumption Expenditures (PCE) report, the Fed’s preferred inflation gauge. There are bound to be days of amplified selloffs but, with the S&P 500 and Nasdaq Composite heading back toward their all-time highs, investors are better off letting the charts do the talking.
Your next great trade might be hiding in plain sight. Find it faster with MarketCarpets.
Disclaimer: This blog is for educational purposes only and should not be construed as financial advice. The ideas and strategies should never be used without first assessing your own personal and financial situation, or without consulting a financial professional.