The BEST Chart in All 11 Sectors (September 2026)
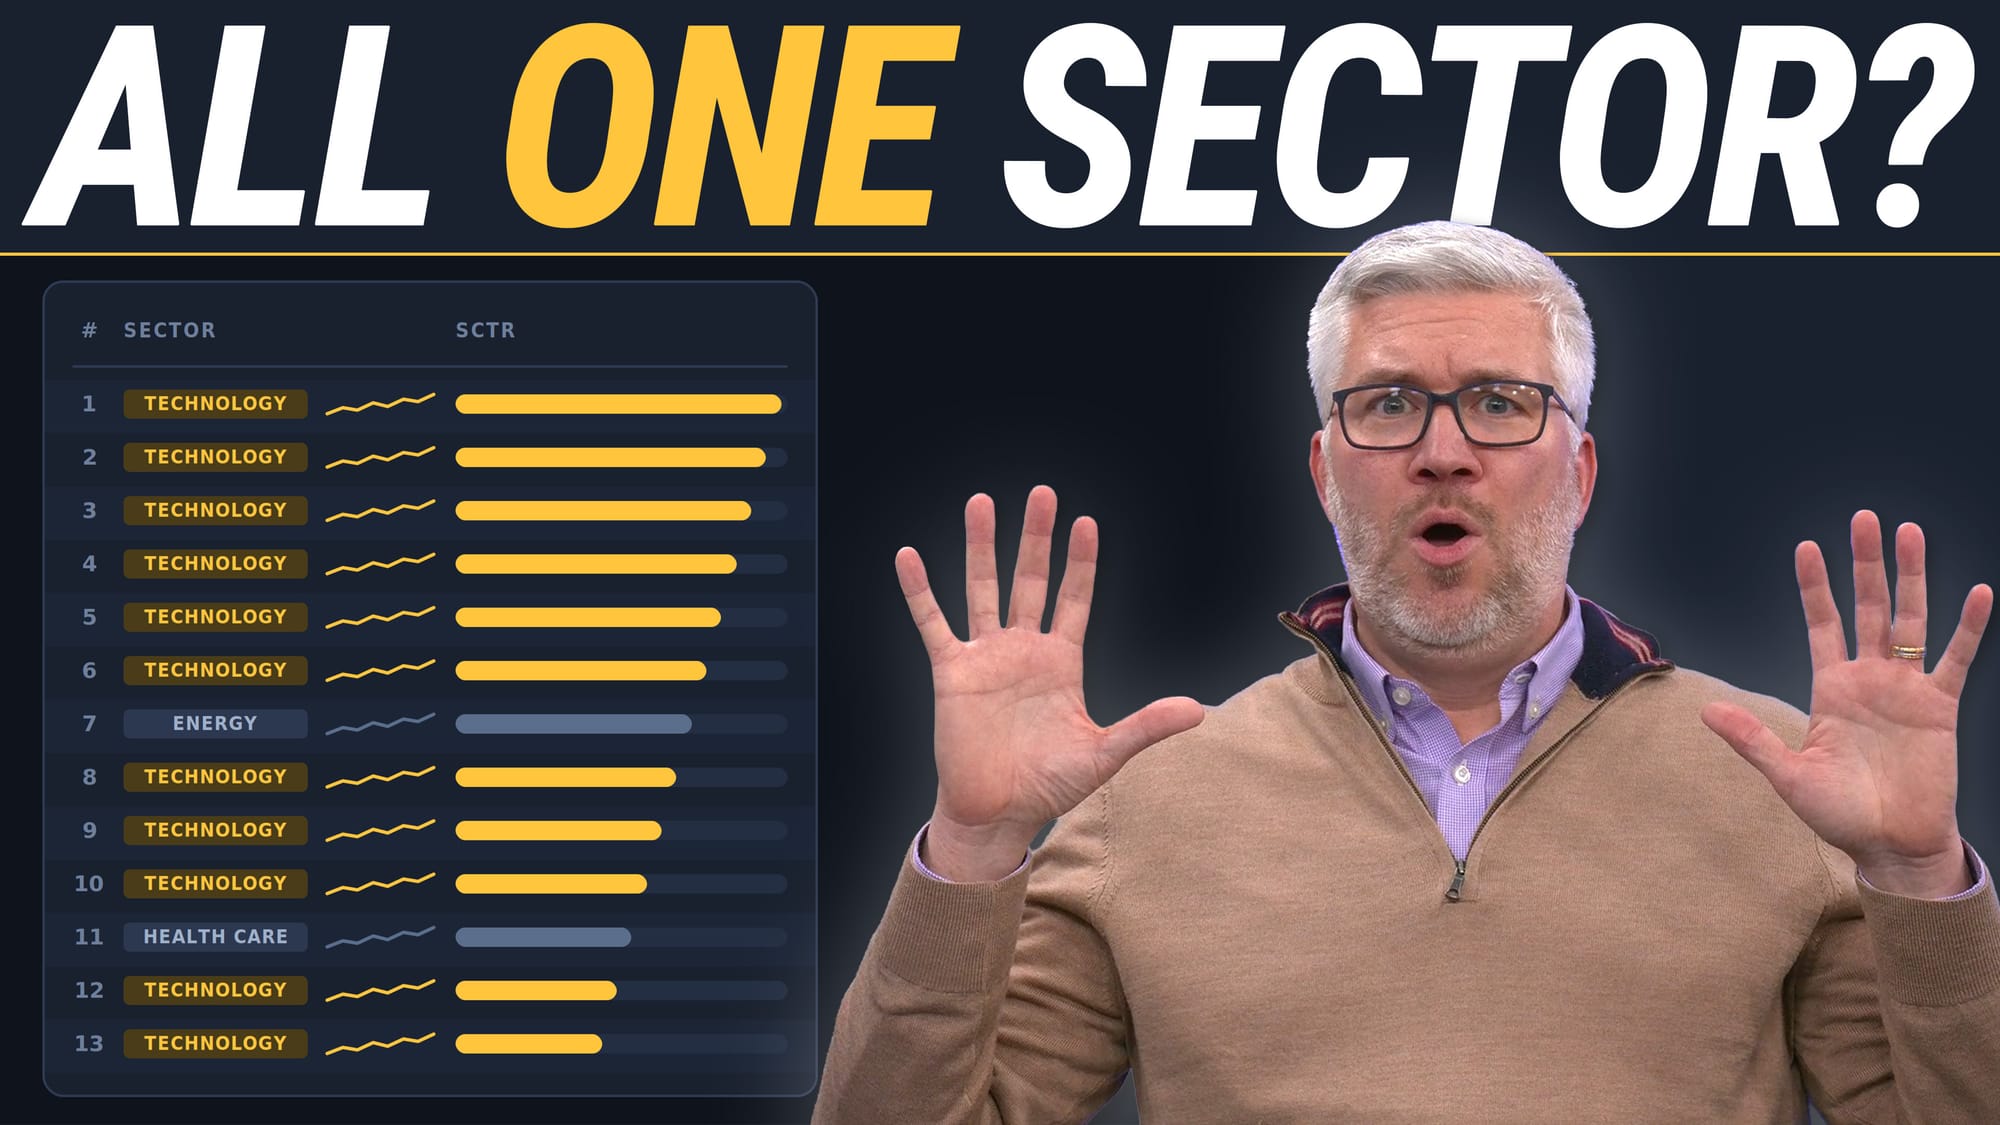
A viewer question kicked this one off: can you actually find a good setup in all eleven S&P groups? The answer starts at Market Analysis, sorting the SCTR reports by universe and ranking, and then applying judgment on top of the raw score. And what comes back is a leadership picture that is startlingly thin.
The very top of the large cap list is almost entirely one industry, and semiconductors keep repeating down the rows. Working through the growth names, then the cyclicals, then the defensives makes that concentration impossible to miss.
This video was originally published on September 22, 2026.
Previously recorded videos from Dave are available at this link.