Bitcoin Finally Breaks Out: Here’s How High It Could Go

Key Takeaways
- Bitcoin hurdled $84,000, triggering a bullish cup-and-handle pattern with a measured move target near $108,000.
- Technical momentum is strengthening, with Bitcoin above its 50- and 200-day moving averages and the RSI back in a bullish zone.
- Seasonality adds another tailwind, with October historically producing strong Bitcoin returns and a 75% positivity rate over the past 12 years.
Is leg two of the debasement trade upon us?
Over the weekend, Bitcoin broke out to fresh highs dating back to January. The surge above $84,000 follows gold’s short-lived August ascent, as the yellow metal climbed from near $4,000 to just shy of $4,700 following a series of fiscal measures and interventions by the U.S. Treasury Department. The latest crypto thrust comes following disappointing fundamental news regarding the CLARITY Act (and a hawkish Fed) but also encouraging regulatory developments relating to tokenization.
No matter the headlines, technicians and swing traders are licking their chops when eyeing Bitcoin’s late-Q3 climb. Let’s dive right in.
Bitcoin & the Vaunted Bullish Cup With Handle
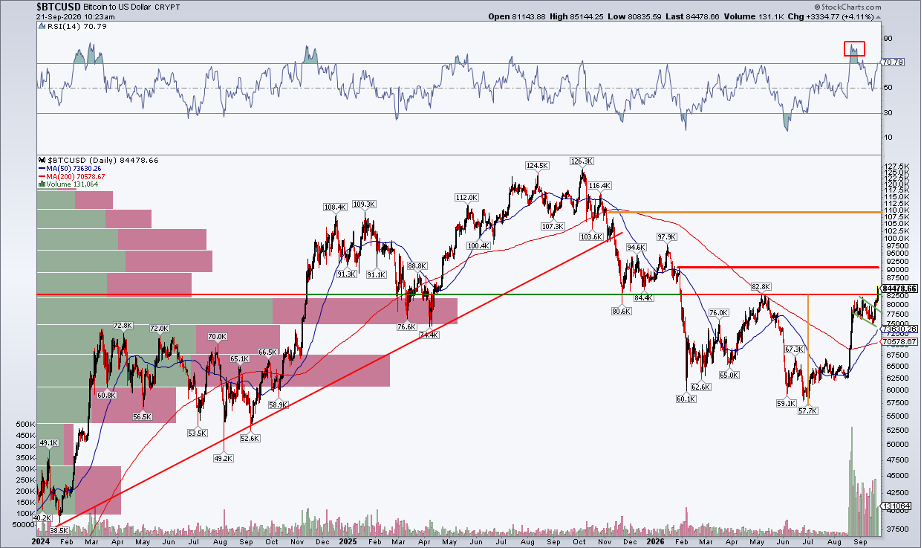
Notice in the chart below that Bitcoin rallied through the major Q2 high of $82,800. The token approached that mark back on September 3, when hopes for the CLARITY Act’s passage peaked. The key technical tell was a simple lack of selling pressure when the legislation didn’t make it through Congress. To that point, whenever a security holds amid seemingly poor fundamental news, the chart is worth watching. Indeed, Bitcoin consolidated in a low-volume pullback before beginning its breakout last Friday.
Today, given the rally to eight-month highs, a measured-move price target of $108,000 is in play, based on the depth of the May through July decline and the subsequent breakout. It’s a classic feature, too, as a clear cup-with-handle pattern is printed. The “handle” part of the cup was the corrective action since August 22 (a bull flag, on its own). Last month, Bitcoin tapped the brakes once it neared its Q2 zenith. The bulls refueled, and the crypto complex appears poised for significant quarter-end gains (during what’s typically a risk-off calendar stretch).
Trend Lines Confirm the Rally
Also look at the long-term 200-day moving average. It's now back on the rise, suggesting that the bulls control the primary trend. A bullish golden cross feature also occurred earlier in the month without much fanfare. With the 50-DMA zooming upward and price above both trend indicator lines, the upside breakout has solid technical backing. The RSI momentum oscillator at the top of the SharpChart, meanwhile, cooled after hitting major overbought territory in August. On that note, the RSI has been in a bullish zone (above 40) throughout the quarter.
Before the $108,000 target can be hit, I see the Bitcoin bulls potentially struggling in the low $90,000s. That was the early-year breakdown spot, and price has a way of recalling the past. Above that, $97,900 is the YTD peak, which could offer some psychological resistance.
The volume-by-price profile on the left side of the chart is also interesting. There’s now a high number of tokens traded below the current level, which should provide a cushion if we see another consolidation (though the presumption is that price should not fall back into the cup).
Bitcoin Nearly Positive for the Year After a More-Than 30% YTD Decline
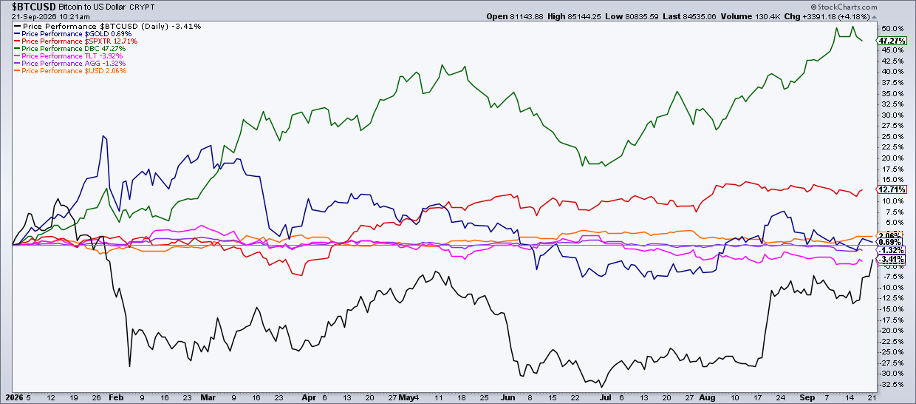
Zooming out, and from a relative performance perspective, Bitcoin is almost back to flat on the year. Down 3%, it has nearly closed the gap to gold’s +0.6% gain in 2026. Stocks, as measured by the S&P 500 Total Return Index ($SPXTR), trounce both pillars of the debasement trade YTD (+12.7% coming into this week).
The broader commodity complex, using the Invesco DB Commodity Index Tracking Fund (DBC), remains +47% YTD. You can view the entire intermarket arena on the StockCharts Market Summary page. Scroll toward the bottom to keep tabs on all the major cryptocurrencies and hard assets.
The Relative Chart Isn’t Quite There
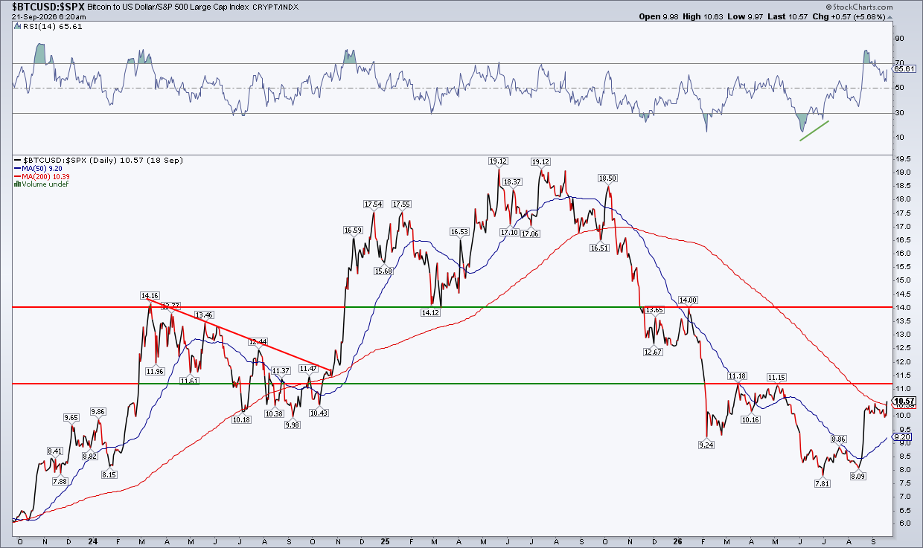
Elsewhere, it’s always relative with Bitcoin. If, say, the S&P 500 is in rally mode, there’s an opportunity cost to bypassing U.S. large caps. Right now, the S&P 500 is close to its record high tagged on August 13, but price action has been rather choppy since early June. That sideways trend in equities makes the Bitcoin relative chart look even better.
The $BTCUSD:$SPX relative chart still has wood to chop, but the ratio did crack above the still-falling 200-DMA this week. I’d like to see Bitcoin (relative) rally through the March high of 11.18x to help confirm the pure price breakout. If that occurs, we could see significant money rotate into the world’s most valuable cryptocurrency. On the upside, 14.0x has been a historically significant level.
Dollar Stays Neutral
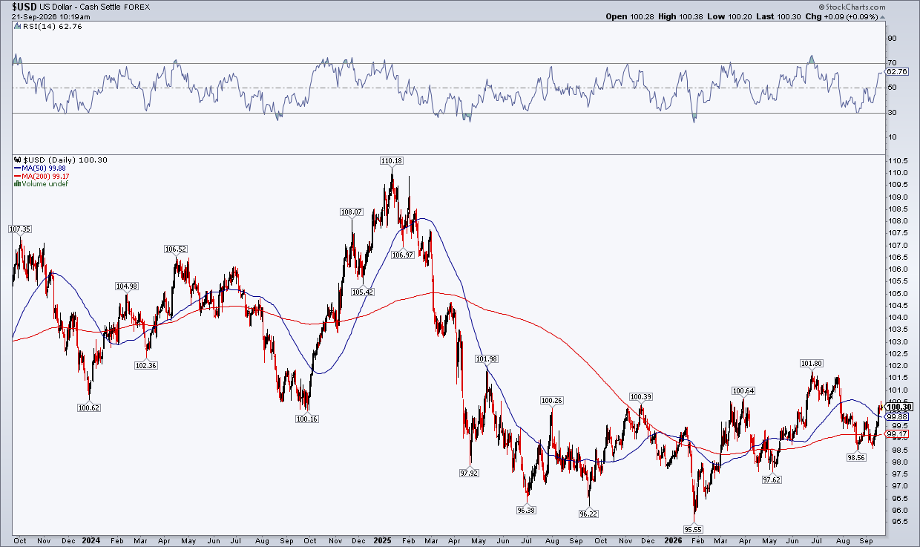
Let's take a quick look at the U.S. Dollar Index ($USD), as the greenback continues to trade unimpressively. A false breakout through 100.6 in June resulted in a fallback to 98.56 a month ago. While it has reclaimed the 100 figure, the 200-DMA remains flat, and the nearly 18-month-long range is assumed to continue until definitive signs point to something different.
So, no major signal from the currency space, which Bitcoin often keys off of.
October Has Been Bullish
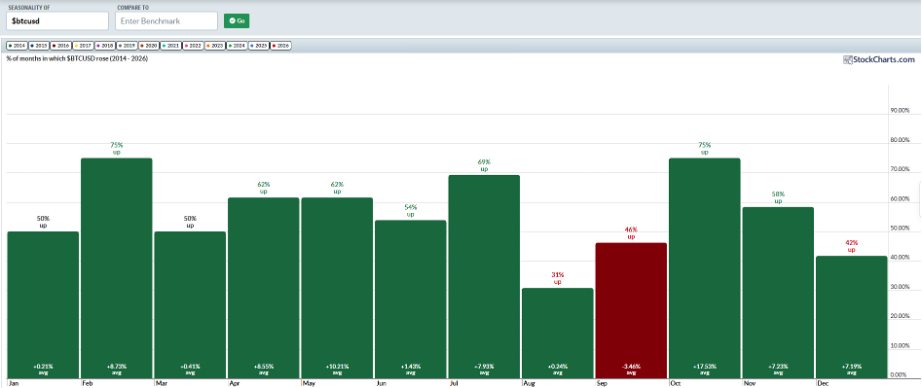
A final chart to keep in your back pocket is seasonality. October is a strong month for Bitcoin when scanning price performance data over the past 12 years.
The average gain is 17.5%, with a strong 75% positivity rate.
The Bottom Line
Bitcoin broke out over the weekend. A bullish cup-with-handle pattern triggered, and $108,000 is now in play. News stories aside, the technical setup appears strong, while calendar trends are sanguine heading into the fourth quarter.
StockCharts members get the full cross-asset picture. Visit the Market Summary page and dive into the Other Assets panel to see how cryptocurrencies, commodities, and currencies are moving.
Disclaimer: This blog is for educational purposes only and should not be construed as financial advice. The ideas and strategies should never be used without first assessing your own personal and financial situation, or without consulting a financial professional.