Semiconductors Just Took the Lead. Can the Rally Keep Going?
A new Fed Chairman, a memorandum of understanding between the U.S. and Iran, and soaring semiconductors. For a short week, there was plenty to talk about.
In this update:
- Semiconductors lead the market
- New indicators and overlays
- Upcoming virtual event
After such an eventful week, I was especially eager to visit the Market Summary page after Thursday’s close. One thing that jumped out was the strength in semiconductors. A +7.26% rise is hard to ignore!
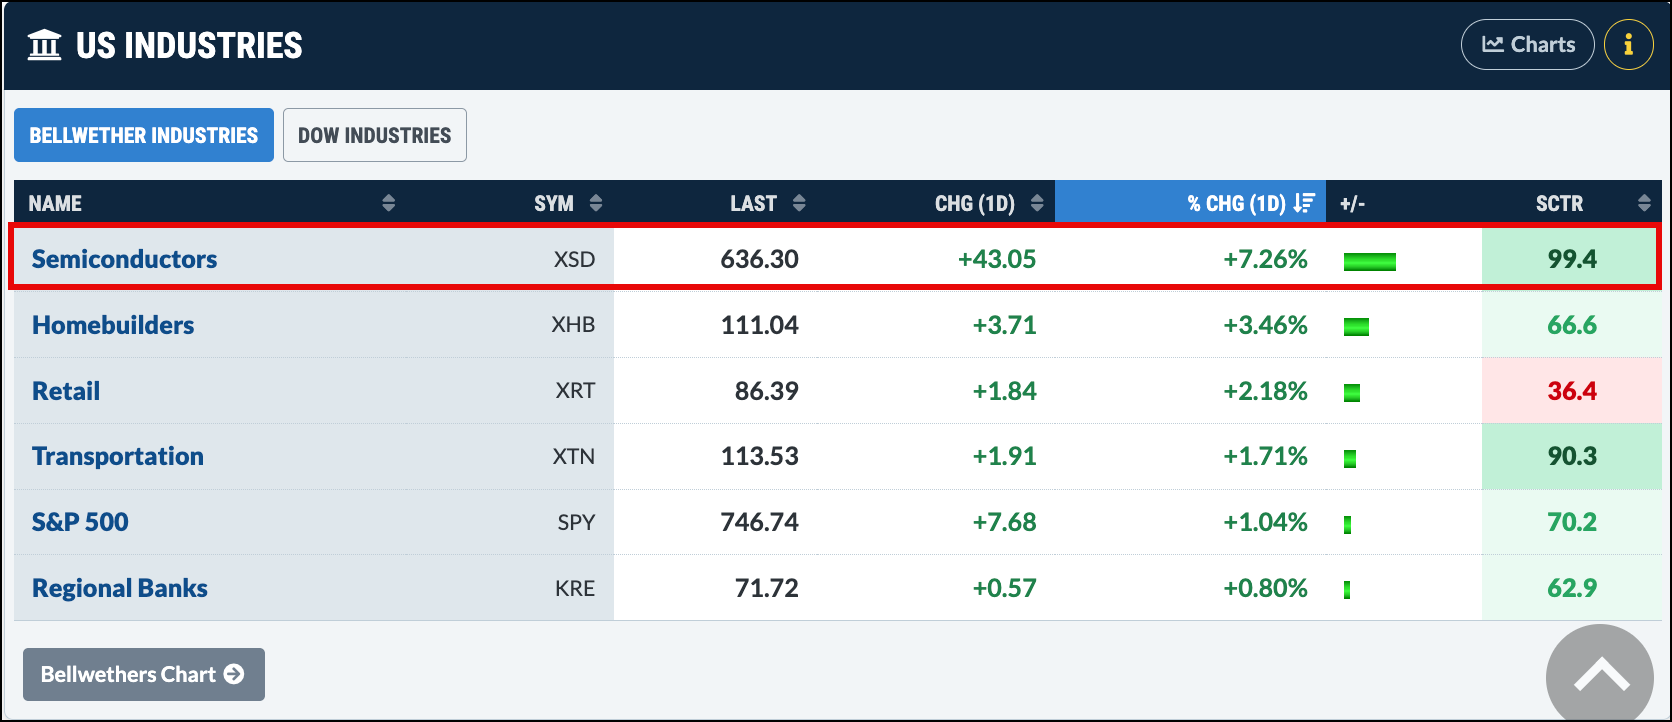
The chart of the SPDR S&P Semiconductor ETF (XSD) shows a clear uptrend, strong performance relative to the S&P 500 ETF (SPY), and a Relative Strength Index (RSI) sitting between neutral and overbought. This suggests that XSD may still have room to run.
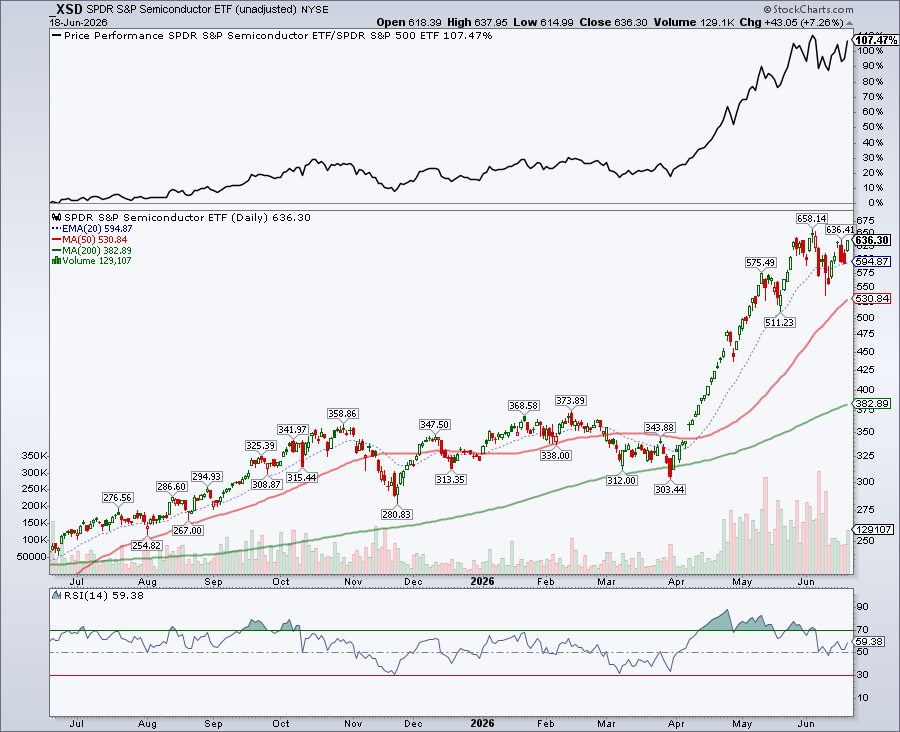
After a few sleepy months, a new trend has awakened. XSD has been trending higher since April, and a further 2.11% gain would put the ETF at its 52-week high. It has also outperformed the S&P 500 by 133.80%. If momentum continues to build, this semiconductor rally could keep going and going.
Where did I get all this data from?
We’ve rolled out several new indicators and overlays in SharpCharts. OK, they’re not exactly “new.” They were already available in StockCharts ACP, but we’ve now brought them into SharpCharts so everyone can access them.
We’ll be talking more about these in the weeks to come. The Alligator, Distance to Highs, and Performance Spread are just three of the indicators you’ll now find in SharpCharts. There are plenty more to explore.
So the next time you pull up a chart, look through the Overlays and Indicators drop-down menus and try a few of them out. Some may become part of your regular process. At the very least, they may give you a fresh perspective.
So, in between the grilling, World Cup, U.S. Open, and Father’s Day festivities, maybe you can find a few minutes to explore these new tools.
And one more thing …
Dave Keller, CMT, will be hosting a webcast this week, where he’ll walk through his seven-point checklist for identifying a market peak.
What: The Market Top Checklist: 7 Red Flags of a Major Market Peak
When: Wednesday, June 24, 2026, 1:00 PM ET.
Have a lovely long weekend and Happy Father’s Day!