Semiconductors Sell Off, Small Caps Step Up: Is Leadership Shifting?
The S&P 500 ($SPX) and Nasdaq Composite ($COMPQ) have spent the entire week in the red, falling every trading day. Throughout the selloff, though, the Cboe Volatility Index ($VIX) has stayed below 20, which suggests that investors aren’t panicking.
This could have something to do with timing. The final trading days of the month or quarter often bring some “window dressing,” when fund managers clean up portfolios, add some positions, or trim others. So while the selloff in tech stocks has been in focus, the stock market isn’t showing the kind of fear you’d expect from a risk-off move.
In this update:
- New SharpCharts indicators
- The Performance Spread indicator
- The AI bubble
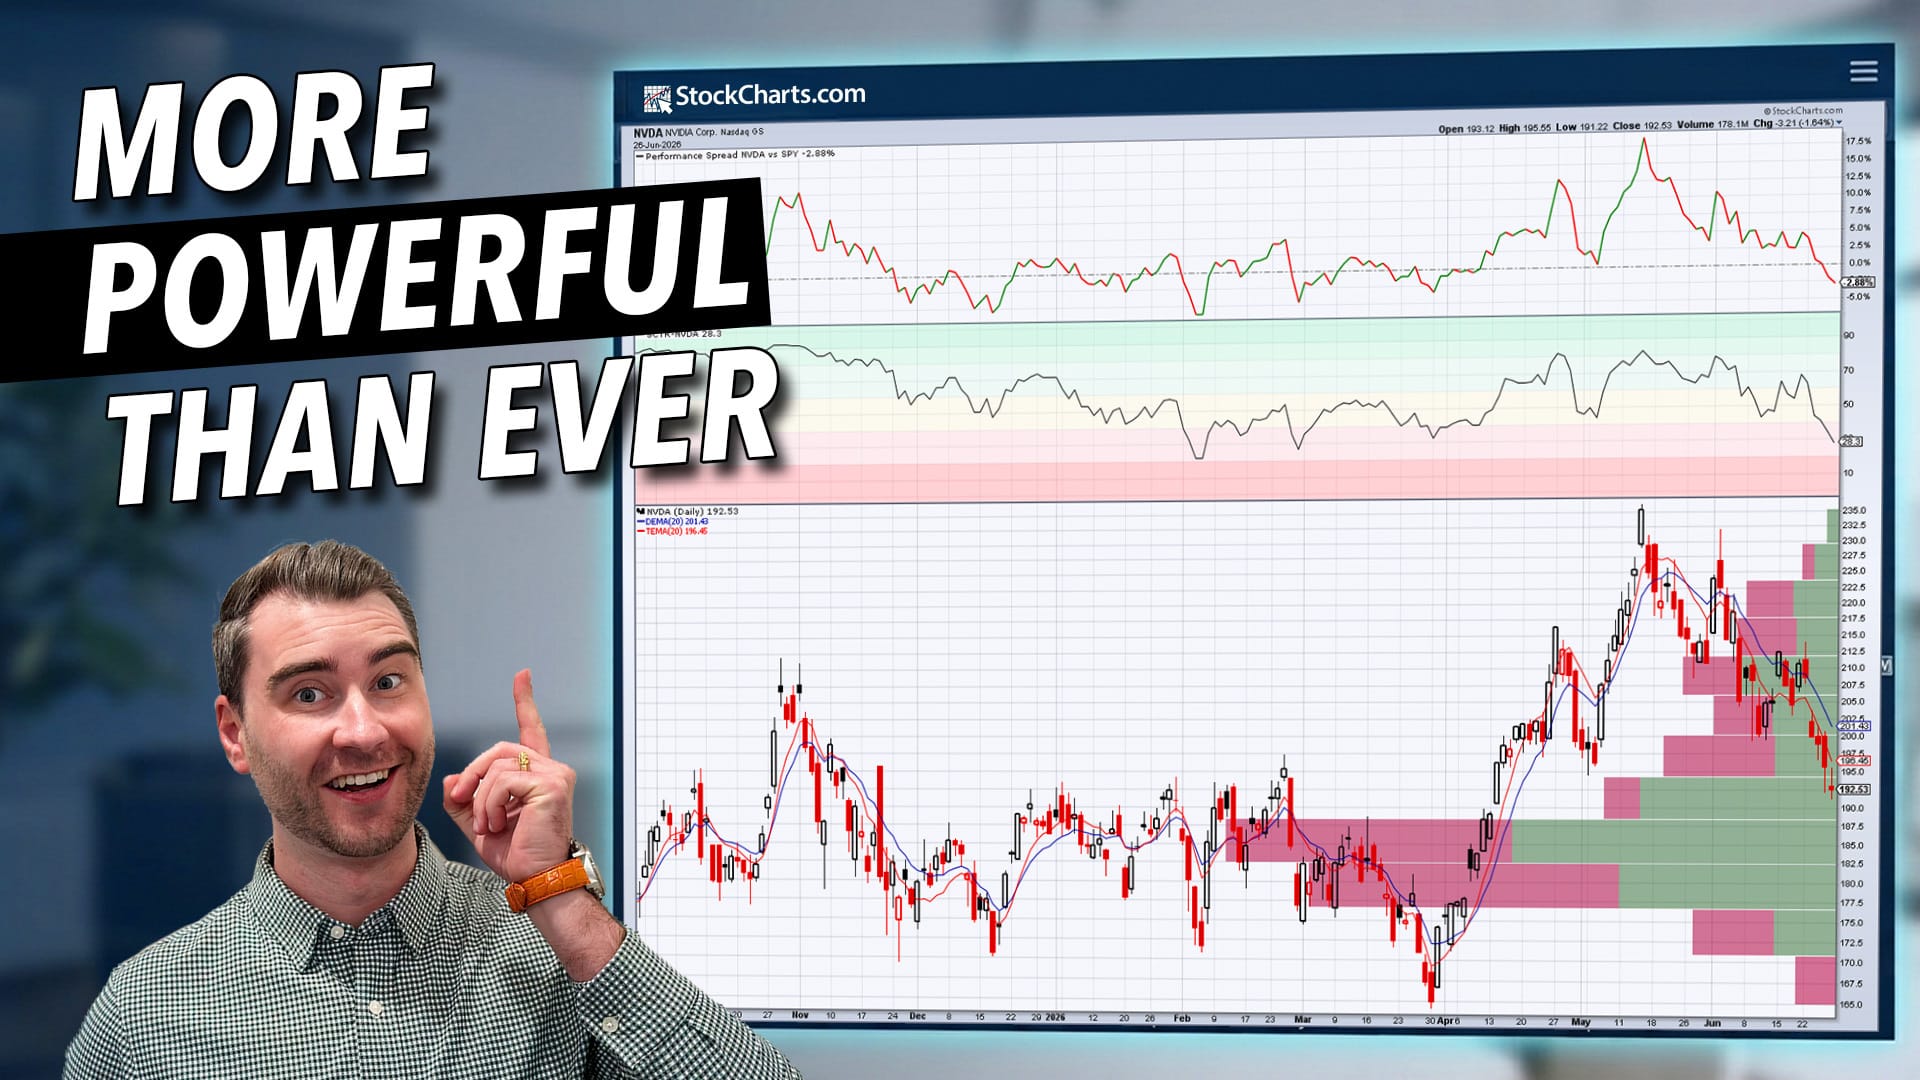
Last week, we mentioned that we added new indicators and overlays to SharpCharts. The video below takes a closer look at those tools and walks you through when and how to use them on your charts (click the image below to access the video).
This week’s selloff in semiconductor stocks has been hard to ignore, even after Micron’s strong earnings report. But investors aren’t necessarily dumping stocks. They appear to be rotating into other asset groups.
The NAIIM Exposure Index (!NAAIM) is sitting at 98.59, which suggests institutional investors are nearly fully invested in equities. You can see this rotation in this week’s price action. Health Care, Real Estate, and Utilities were among the top-performing S&P 500 sectors, an indication that investors are leaning into more defensive areas of the market. Small-cap stocks have been showing impressive strength. The S&P 600 Small Cap Index ($SML) closed at a record high on Friday.
One of the new SharpCharts indicators, the Performance Spread indicator, makes it easier to visualize this kind of rotation and relative strength. Let’s apply it to the iShares Russell 2000 ETF (IWM), which tracks small-cap stocks.
In the chart below, the Performance Spread shows that IWM has outperformed the S&P 500 by about 20% in the past year.
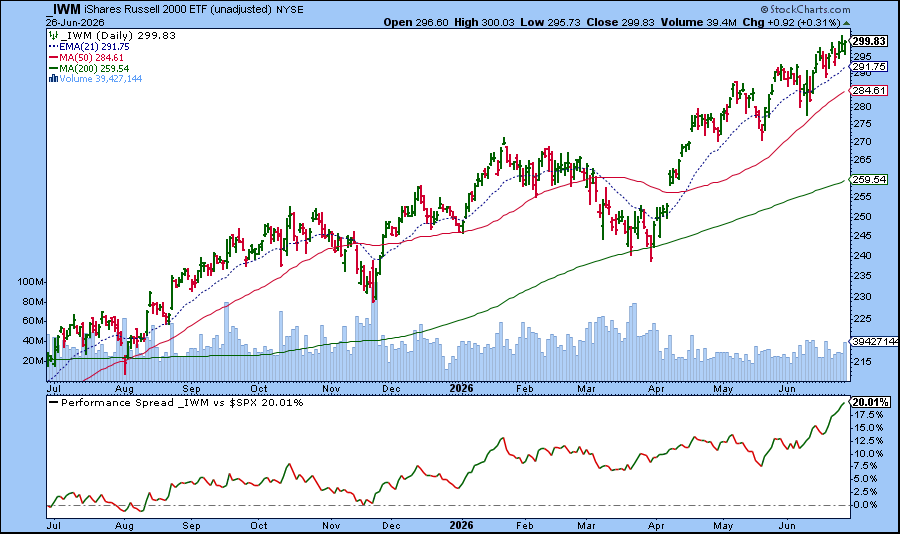
On June 16, IWM was outperforming the S&P 500 by 13.78%. By June 26, the spread had widened to 20.01%. That’s quite a move!
So does this mean it’s time to give small caps more attention? With small-cap breadth expanding (check out the Breadth panel in the Market Summary page), this may be a good time to monitor the small-cap Market Movers Dashboard panel and the top 10 small-cap SCTR performers in the strongest sectors. You can also run scans to filter for small-cap stocks that meet your technical criteria.
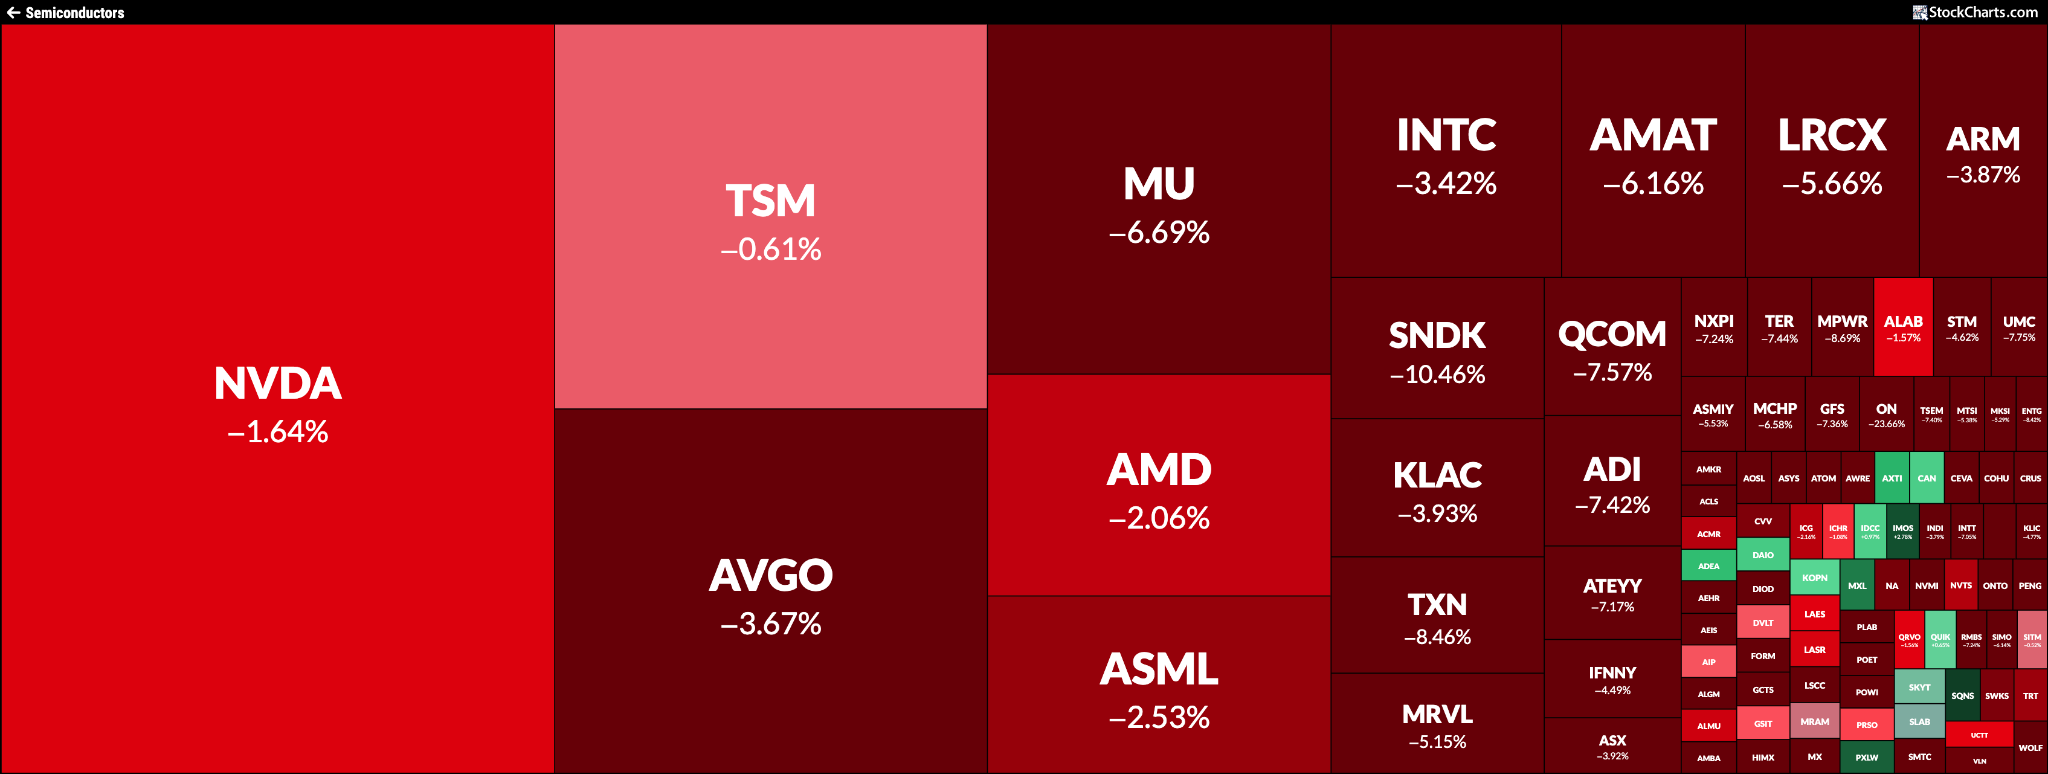
Are AI stocks finally cooling off? Given how overstretched prices have become in the AI space, it wouldn’t be surprising for investors to take some profits in tech, especially as summer comes into full swing. The StockCharts MarketCarpet for semiconductors gives you a clear visual of what’s happening across the group.
But is this a bubble about to burst? For a deeper look, consider joining Tom Bowley’s livestream event this weekend. He’ll walk through the signals he watches to determine whether semiconductors have entered bubble territory.
What: Is This an AI Bubble?
When: Saturday, June 27, 2026, 10:00 AM ET
Have a great weekend!