Week Ahead: Lack Of Leadership: This Resistance Cluster May Test Nifty’s Patience

The market traded in a subdued and range-bound manner through the week, ending flat with modest gains. Nifty oscillated in a relatively narrow 476.65-point range, touching a high of 24,261.60 and a low of 23,784.95 before settling at 24,056.00. Volatility remained largely contained, with the India VIX rising 0.62% to 13.05. The benchmark index closed the week with a marginal gain of 42.90 points (+0.18%), reflecting the ongoing lack of directional conviction.
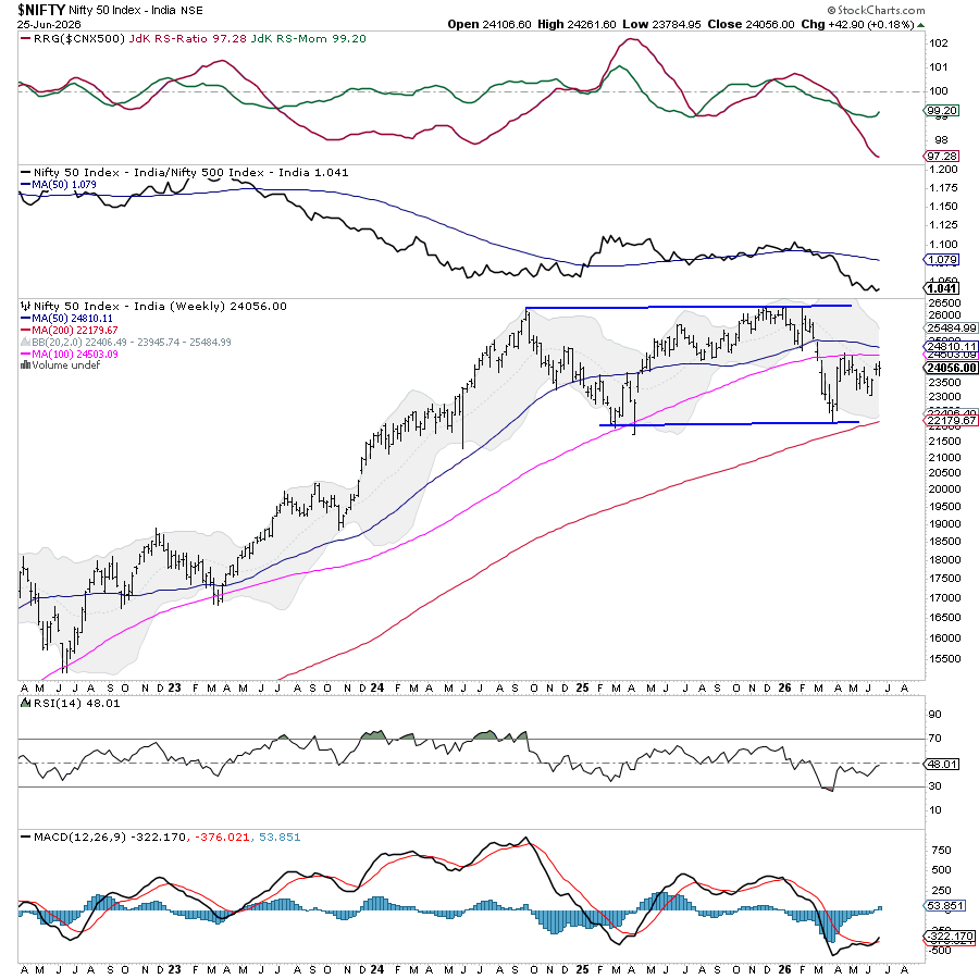
The broader technical structure remains cautious despite the index stabilizing above its recent lows. Nifty is currently confronting a formidable resistance zone between 24,160 and 24,500, where the 100-day moving average (24,161) and the 100-week moving average (24,504) exist. This cluster makes the zone technically significant and is likely to act as a stiff resistance area. Unless the index registers a decisive move above this resistance band, the ongoing rebound is likely to remain tentative.
The market is likely to begin the coming week, after a trading holiday on Friday, by adjusting to the global trade setup. It is likely to open on a tepid note, but sustained upside will require Nifty to overcome the 24,160–24,500 resistance zone decisively. Immediate resistance levels are placed at 24,160 and 24,500, while supports come in at 23,900 and 23,750. Any move beyond the resistance cluster may trigger stronger short-covering and improve the medium-term outlook, whereas failure to clear this hurdle could keep the index confined to a broad consolidation.
The weekly Relative Strength Index (RSI) stands at 48.01 and remains neutral, not showing any notable bullish or bearish divergence against price. The weekly Moving Average Convergence/Divergence (MACD) remains bullish and above its signal line. The latest weekly candle is that of a Doji; it reflects indecisive price action, underscoring the ongoing tug-of-war between buyers and sellers near an important resistance area.
From a pattern perspective, Nifty continues to trade within a broad consolidation after witnessing a sharp corrective decline earlier this year. The index has now entered a technically important congestion zone where multiple moving averages exist. The inability to reclaim the 100-day and 100-week moving averages keeps the near-term technical bias guarded. A sustained move above this resistance cluster would significantly strengthen the technical structure, while continued rejection from these levels could prolong the consolidation phase.
Overall, the market is entering a technically important phase where risk-reward remains evenly balanced. Fresh aggressive buying should be avoided until the index convincingly clears the 24,160–24,500 resistance band. At the same time, the presence of strong long-term support argues against adopting an overly bearish stance. Traders should continue with a selective, stock-specific approach while maintaining disciplined risk management. Protecting capital, avoiding excessive leverage, and waiting for a confirmed breakout before turning aggressively bullish would remain the most prudent strategy for the coming week.
Sector Analysis for the Coming Week
In our look at Relative Rotation Graphs®, we compared various sectors against the CNX500 (NIFTY 500 Index), representing over 95% of the free-float market cap of all the listed stocks.
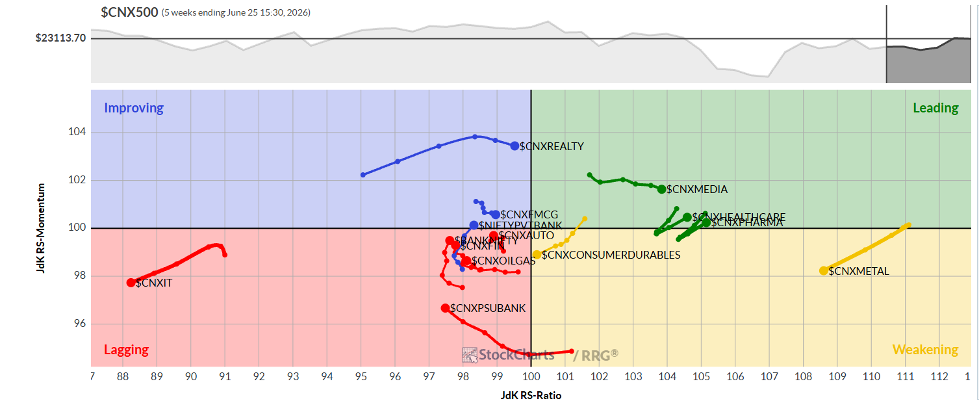
The Relative Rotation Graph (RRG) shows that the Nifty Pharma Sector Index has rolled inside the leading quadrant. Along with that, the Media and Midcap 100 Index are also inside this quadrant. These groups may outperform the broader Nifty 500 Index relatively.
The Nifty Energy Index has rolled inside the weakening quadrant. The Nifty PSE, Metal, and Infrastructure Indexes are also inside this quadrant. The overall relative performance of these groups may continue to slow.
The Nifty IT sector continues to languish inside the lagging quadrant. The Nifty Services, PSU, Bank, Financial Services, and Auto Indexes are also inside the lagging quadrant, but they appear to be improving their relative performance against the broader markets.
The FMCG and the Realty Index continue to be inside the improving quadrant, with the FMCG Index gradually giving up its relative momentum against the broader markets.
Important Note: RRG™ charts show the relative strength and momentum of a group of stocks. In the above chart, they show relative performance against the NIFTY500 Index (Broader Markets) and should not be used directly as buy or sell signals.
Milan Vaishnav, CMT, MSTA
Consulting Technical Analyst
www.EquityResearch.asia | www.ChartWizard.ae