StockCharts Insider: Build Your Dashboard Cockpit Before Takeoff
Before We Dive In…
Many traders think “edge” comes from methods and indicators. It doesn’t. Edge comes from structure. Structure aligns your scale of observation with your knowledge, tools, and processes. When those elements work together, dynamically and in combination, that’s where edge emerges.
If your workspace is chaotic, your decisions will be reactive. But if your dashboard is intentional, your decisions become strategic. Customization is how you make that shift. It puts your pieces in place and lays out the map before you engage the territory.
Here’s a piece of insider wisdom: Think of customization as cognitive architecture. It’s your strategy HQ. Today, I’ll show you how to build it.
The Key Tools for Customization
Here’s the easy part. Go to your Dashboard, find the settings icon at the top right, and click on it.
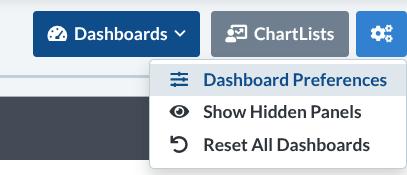
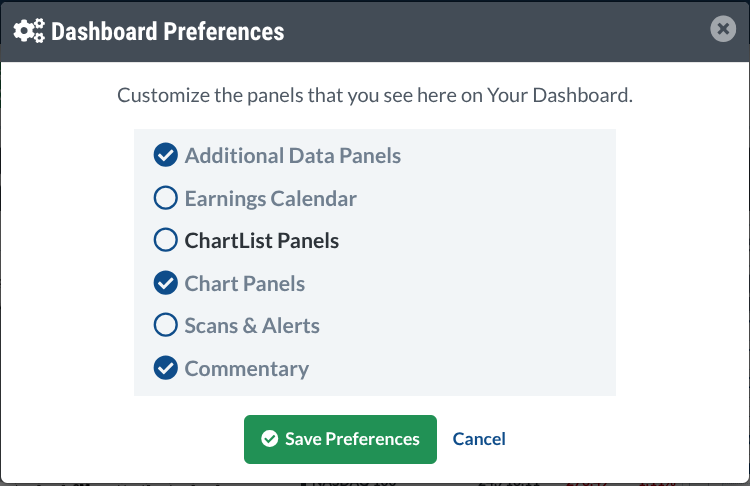
Next, select Dashboard Preferences. This opens the control panel where you decide what appears and what doesn’t.
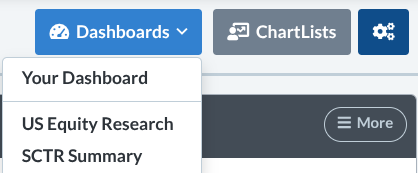
The Dashboard menu also offers specialized views such as Equity Research and SCTR dashboards, which provide different structural perspectives on the market.
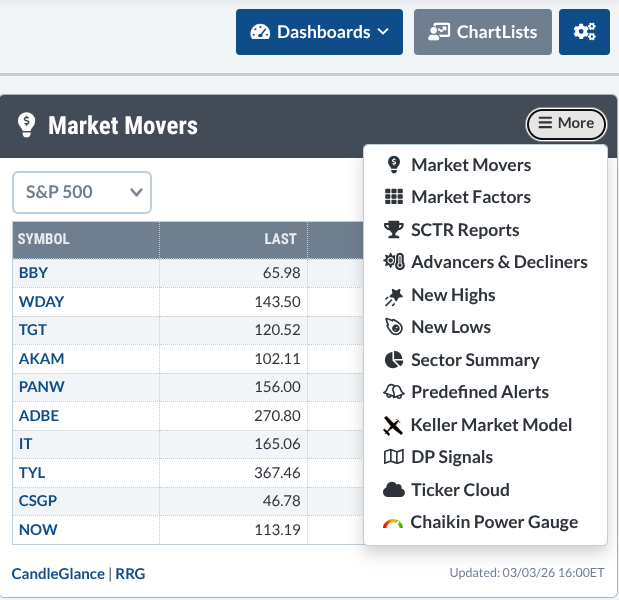
And, within each panel, the top-right menu allows further refinement.
You’ve seen the instruments. But the real advantage isn’t knowing what’s available. It’s knowing what belongs in your field of view. No single layout works for everyone; the objective is to configure your instruments strategically so your dashboard reflects your timeframe, your strategy, and your risk profile.
Let’s build some layouts.
Insider Tip #1 - The Earnings-Focused Trader Layout
For traders who care about catalysts first, charts second.
Panels:
- Earnings Calendar
- Market Movers
- Sector Summary
- Chaikin Power Gauge
- Chart Panel (for quick confirmation)
Why this works: If earnings are your fuel source, your layout needs a radar for scheduled volatility. You want to know who is reporting and when, where the volatility is, and which sectors are moving. Of course, you may prefer other market data, but this is just an example of what you can do.
Insider Tip #2 - The Pure Technical Trader Layout
For traders who need to see momentum, technical strength, and various technical scans.
Panels:
- Chart Panel (multi-timeframe)
- SCTR Reports
- Scans & Alerts
- New Highs and New Lows
- Advancers & Decliners
Why this works: This setup leans more heavily toward keeping an eye on market behavior—technical strength, key levels, scans, leadership, momentum, and breadth.
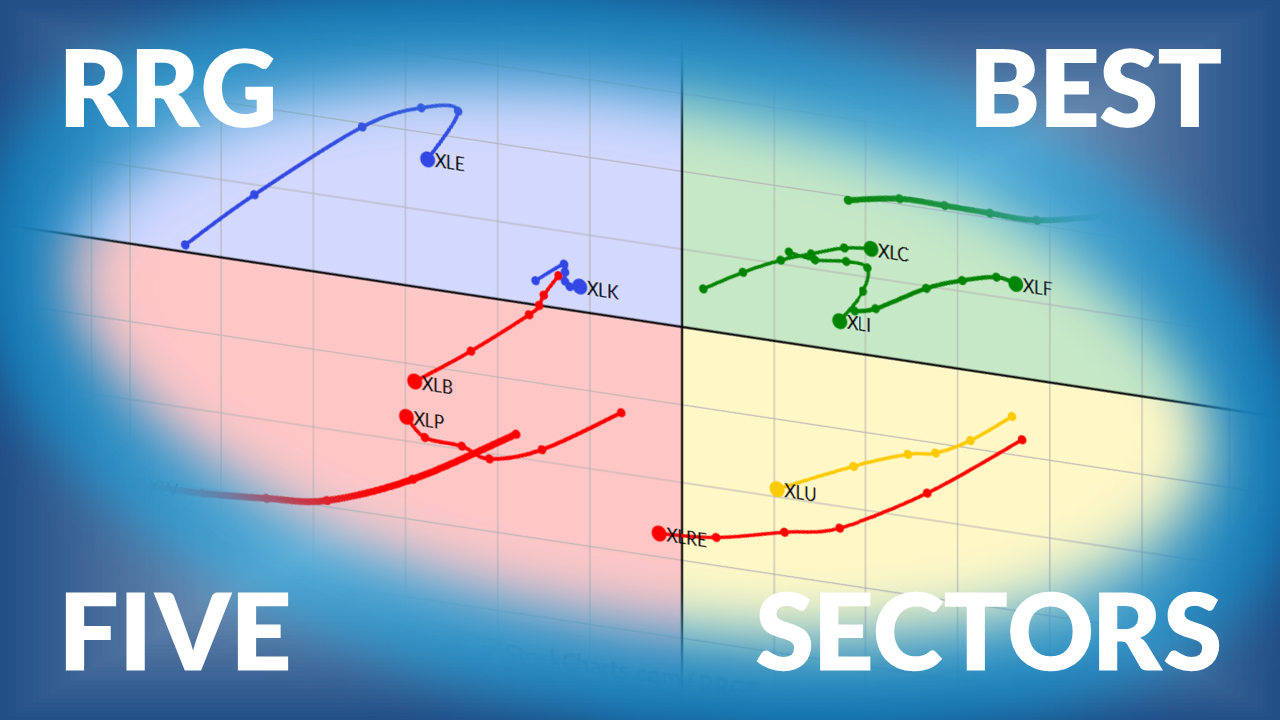
Insider Tip #3 - The Relative Strength/Rotation Layout
For traders who follow sector rotation and market leadership.
Panels:
- Sector Summary
- Market Factors
- Advancers & Decliners
- Chart Panel
- ChartList of leadership stocks or sector or style ETFs
- SCTR Reports (optional)
Why this works: This layout is like your “capital flow radar” across sectors, industries (if you include the SCTR panel), and style categories. It lets you zoom from the big picture down to individual charts.
Insider Tip #4 - The Market Internals Layout
For macro-aware, regime-sensitive traders.
Panels:
- Advancers & Decliners
- New Highs and New Lows
- Market Factors
- Chaikin Power Gauge
- Market Movers
Why this works: If your decisions are largely driven by the market internals, you can use this layout to monitor participation and movement within indexes and the broader market.
Insider Tip #5 - The Long-Term Investor Layout
For position traders and longer-term investors.
Panels:
- Earnings Calendar
- Sector Summary
- Commentary Panel
- Chart Panel (weekly/monthly)
- Scans & Alerts
Why this works: You’re combining fundamentals and technicals across a wider time horizon. You want to get rid of the noise and focus on the larger structural picture, namely economic drivers and long-term price trends. The Scans & Alerts panel allows you to input various criteria for longer-term stock selection and keep tabs on potential trading triggers.
Customization is Key
You might look at one of the proposed layouts above and think to yourself: “I disagree. I don’t need panel X but I certainly need panel Y.” That’s the whole point. That’s customization.
Customization is not about adding everything. It’s about adding only what fits your mission.
Here’s a hypothetical layout. It might not be useful to anyone besides a person who likes to follow sector, breadth, and sentiment indicators. But check it out anyway.
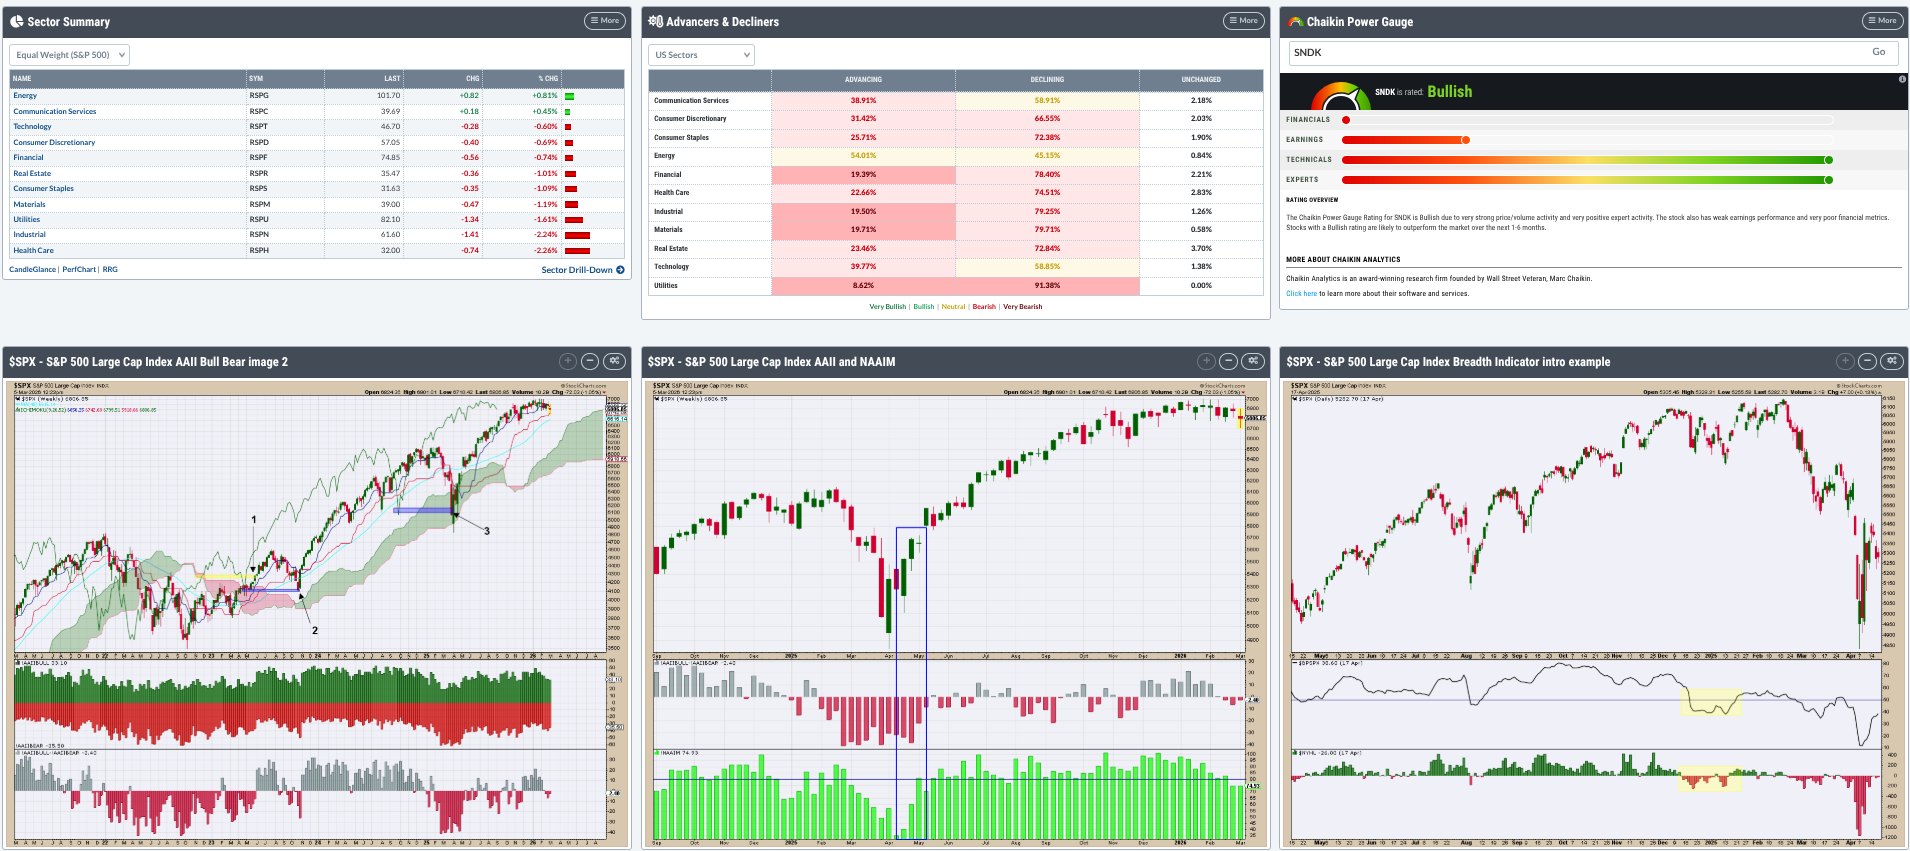
It probably doesn’t fit the way you see the markets, so go ahead and create your own.
And That’s a Wrap
Your Dashboard is more than a “workspace.” It’s your decision engine. The panels you choose determine what information reaches you first. Remember that seasoned traders don’t just analyze the markets differently, they structure their information differently. Your edge, however you build it, will rely on your structure.
So, build your layout carefully. Once the market opens, you want your instruments already in place.