StockCharts Insider: How to Use MarketCarpet and SCTR to Spot Potential Leaders Early On
Before We Dive In…
There are plenty of tools on StockCharts for tracking emerging leaders. But only one enables you to find them quickly through color codes. Here’s a simple method: pair StockCharts Technical Rank (SCTR) with MarketCarpets. Now you can identify stocks that are rotating from average performance to leadership. The trick is to catch these before they hit the top of the rankings.
Hunting Emerging Leaders in the S&P
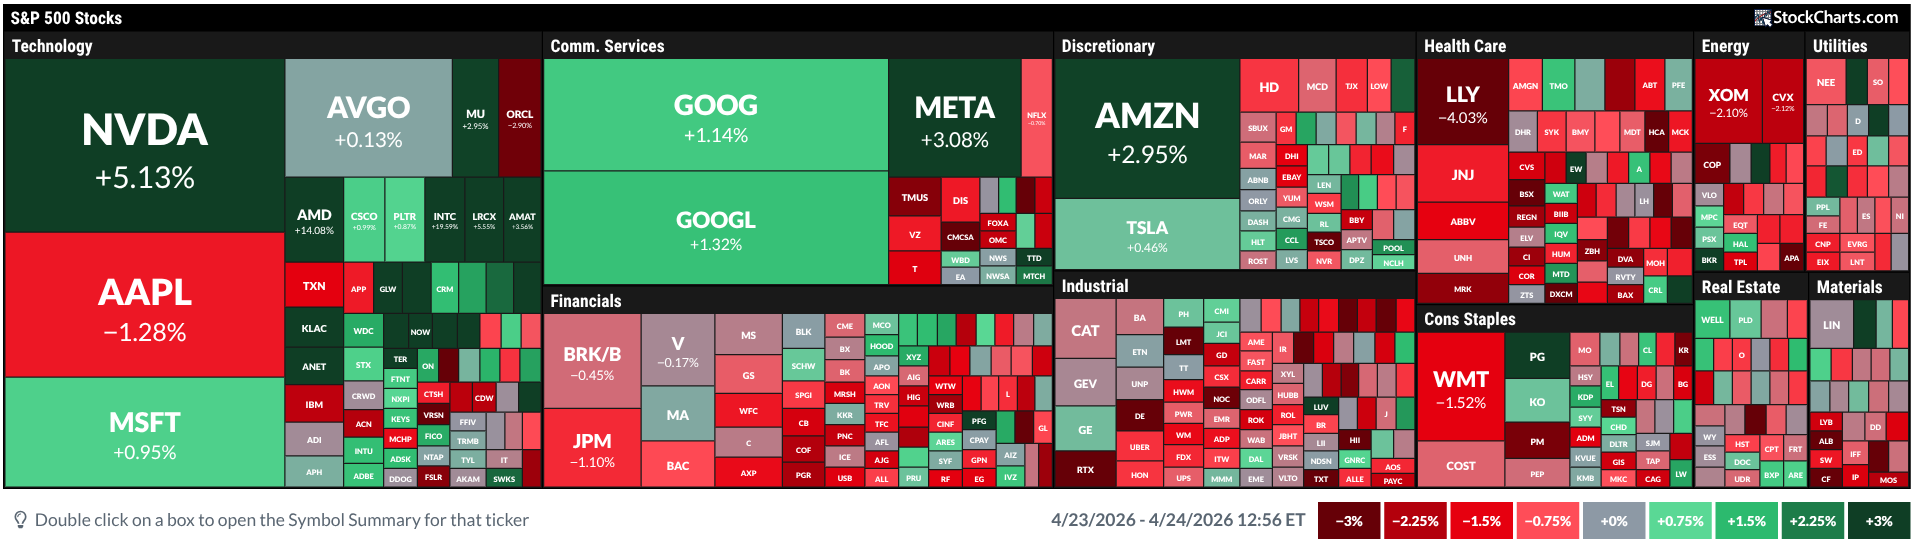
Take a look at the default MarketCarpet page detailing the index’s 1-day performance.
Suppose you want to find technically strong stocks that may be strengthening toward leadership? All you have to do is make a few adjustments in the criteria. Take a look below.
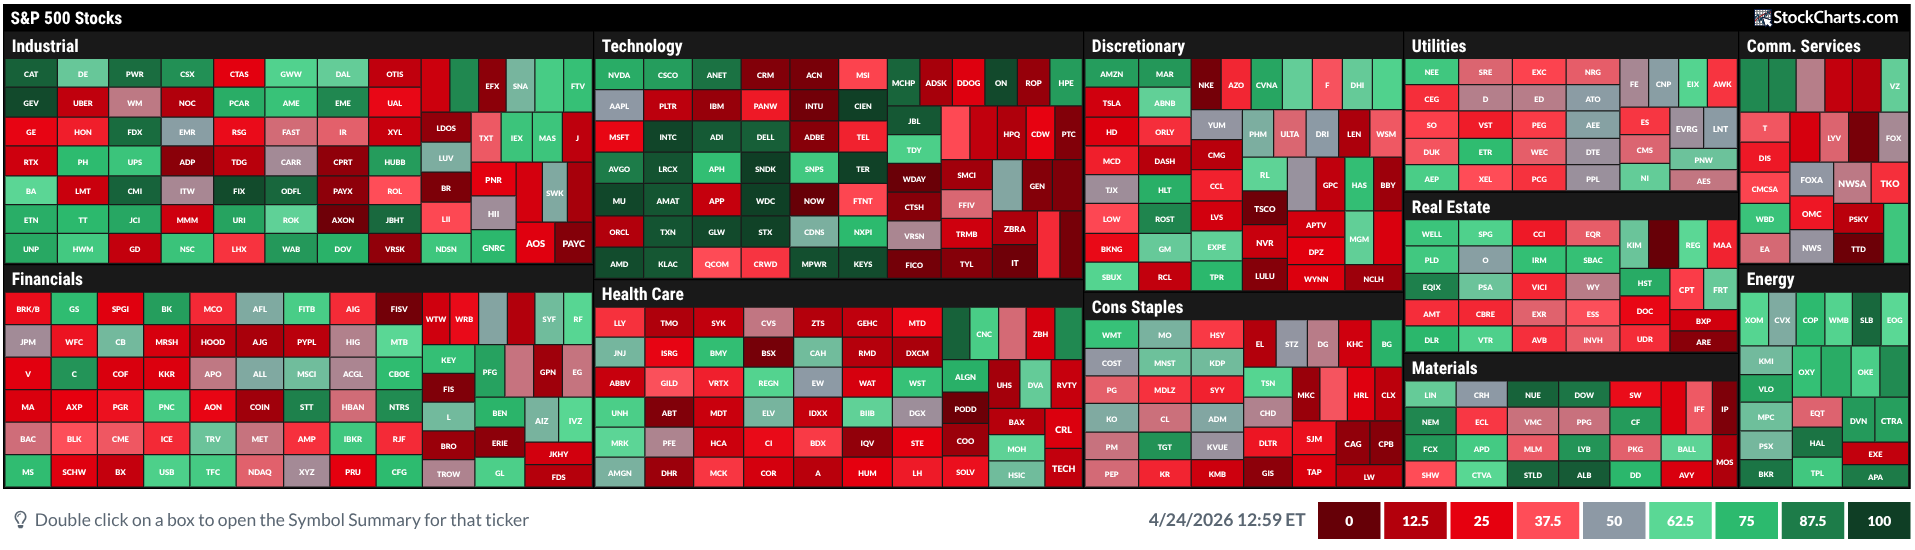
You can’t see the individual names or their values because the squares are too small (I changed the size from market cap to equal weight). But it doesn’t matter. Colors on the higher end of the scale (roughly 70+ SCTR) are what you should focus on.

That indicates stocks with a StockCharts Technical Rank (SCTR) of 75. Ideally, you want to target stocks that are at 70+ or getting close to it. Now, you can turn this into a repeatable workflow.
The MarketCarpet SCTR Workflow
Here it is: scan -> validate -> confirm -> decide.
Let’s go through each step.
Step 1: Start with SCTR (Latest Value)
- Open a MarketCarpet
- Set Measurement = SCTR (Latest Value)
- Focus on stocks in the 60–75 range
This is what we just did above. SCTR above 75 places a stock in the top quartile of its universe, while the 60–75 range often captures names transitioning toward leadership.
Insider Tip #1: Be ultra-discriminating with stocks at 90+ SCTR. The highest SCTR names may be good candidates, but many are also late-stage leaders. So, you have to evaluate their position in the market (technically and fundamentally) to avoid jumping into a stock that’s bound for a pullback. For our aim in this article, rising SCTR matters more than high SCTR.
Step 2: Check sector context (breadth matters)
First, zoom out. You can do this without changing your MarketCarpet view. Look at how the colors are distributed and whether strength is clustered or isolated.
Ask:
- Is the strength isolated?
- Or is the entire sector green?
Suppose I’m looking at Consumer Staples and spot the square at the top right. I scroll over it and learn that it’s Walmart Inc. (WMT). Now, let’s zoom in.
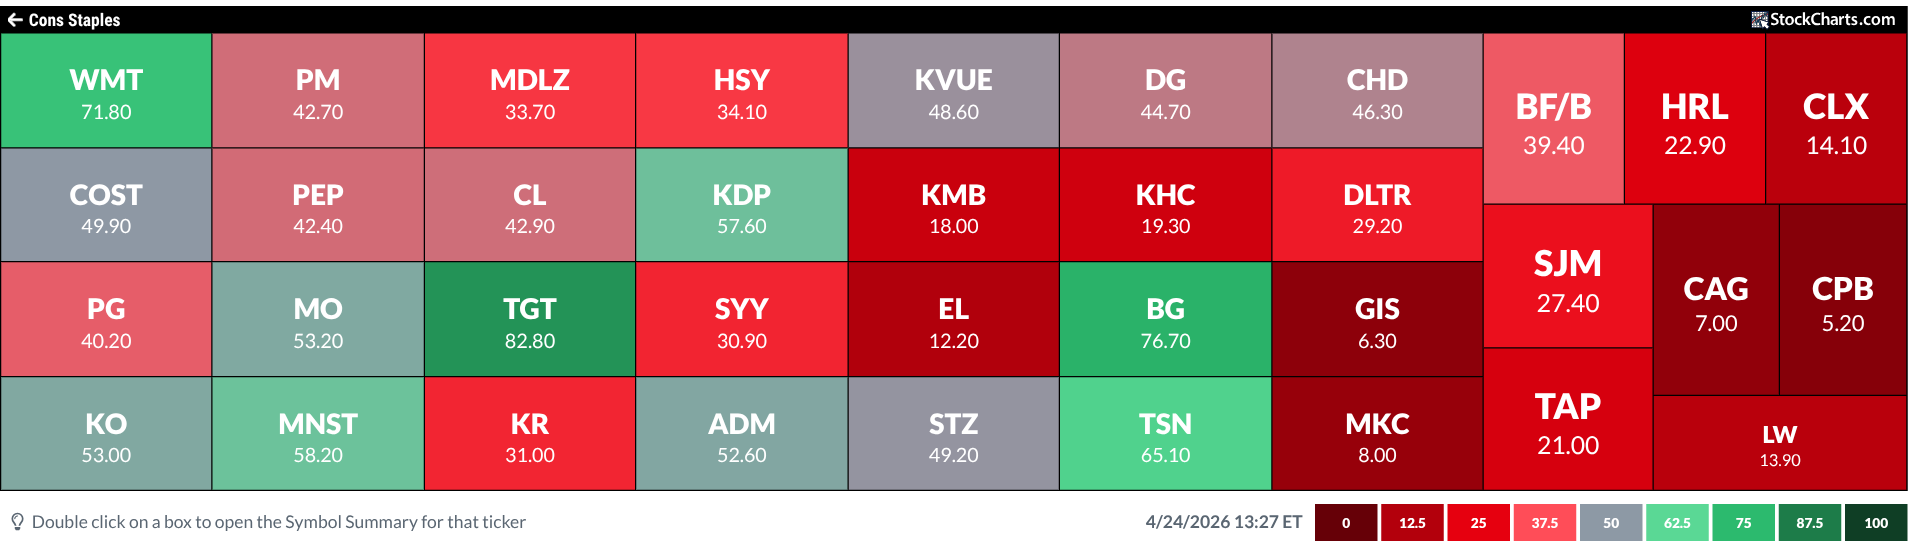
WMT is one of 5 stocks within the entire sector whose technicals are strengthening. So, we’re seeing stock-specific strength. But, again, this is movement in technical strength, not performance. What’s the sector performance like? That’s what we need to look at next.
Insider Tip #2: Strength without participation can signal leadership or fragility. When a lone stock is strengthening while the rest of the sector is staying put or decreasing, is it noise, a short-term move, does it have enough juice to buck the trend? It could be either, which is why you need to go a few steps further to figure out whether the stock is losing steam or a true bullish outlier.
Step 3: Toggle timeframes (5D → 1M → 3M → 6M)
This is an extra step for me, but since it’s so easy to do, I’ve included this in the workflow. Basically, toggling through these timeframes for both SCTR and Performance may seem like a lot of work. But you can do this in literally less than a minute. So, why not?
Here’s a quick performance toggle of Performance:
The 5-day looks so-so.
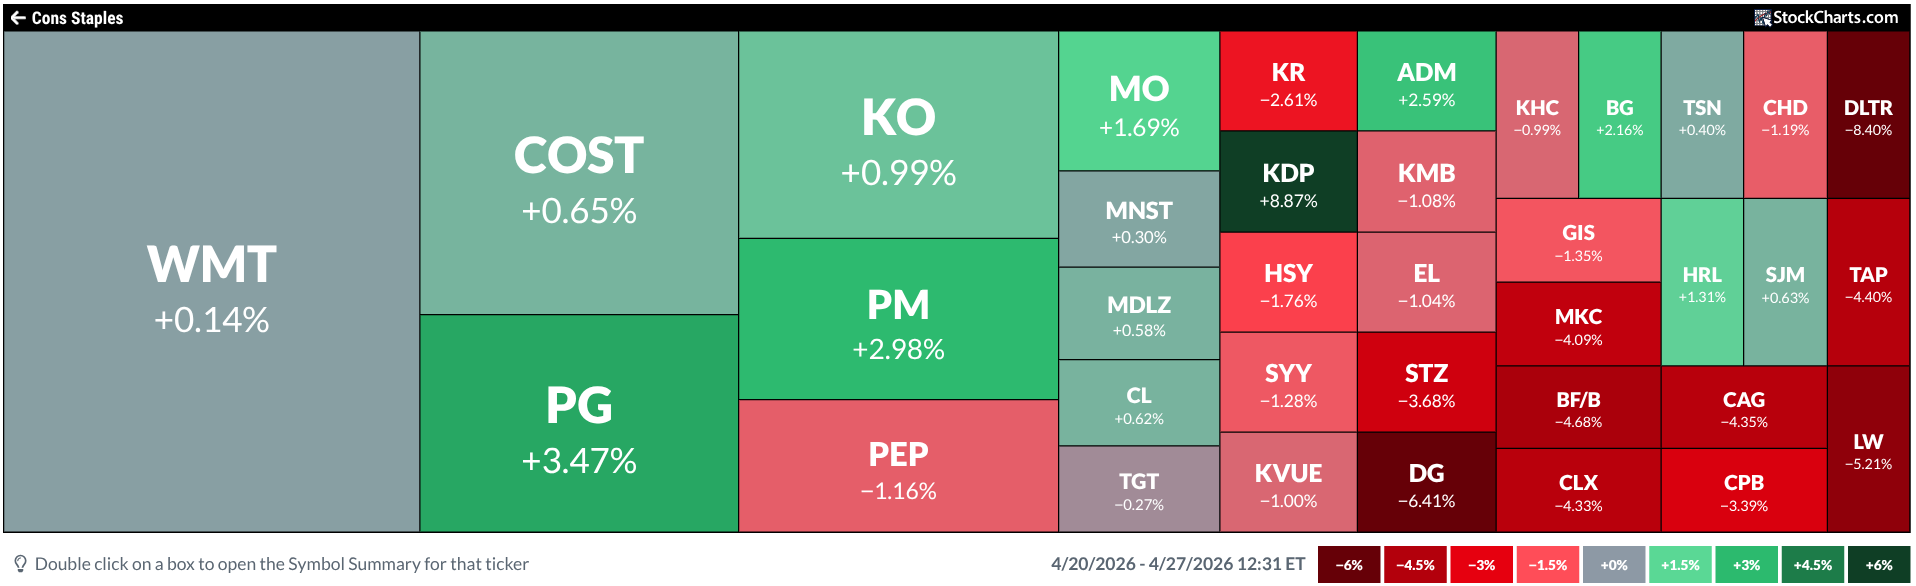
The 1-month looks better.
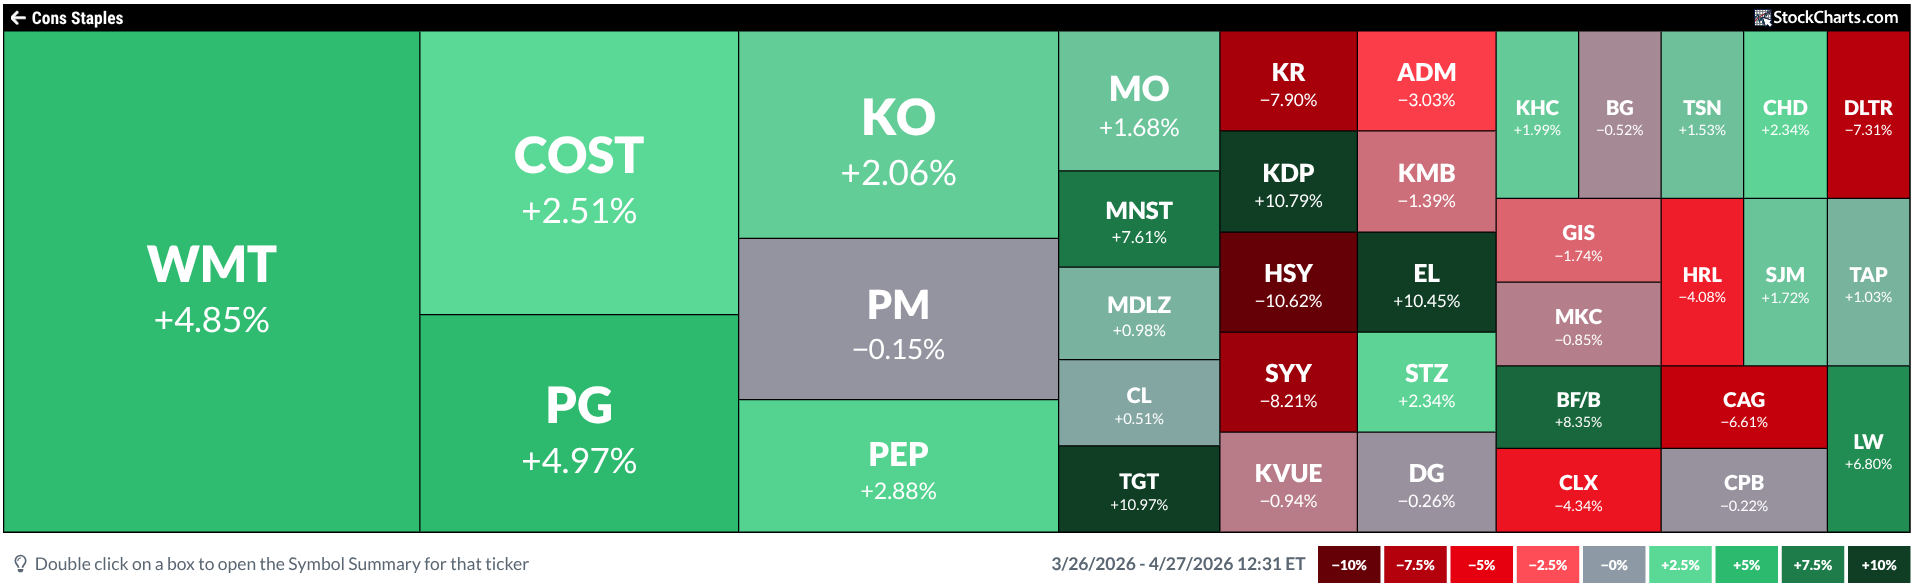
The 3-month performance looks stronger.
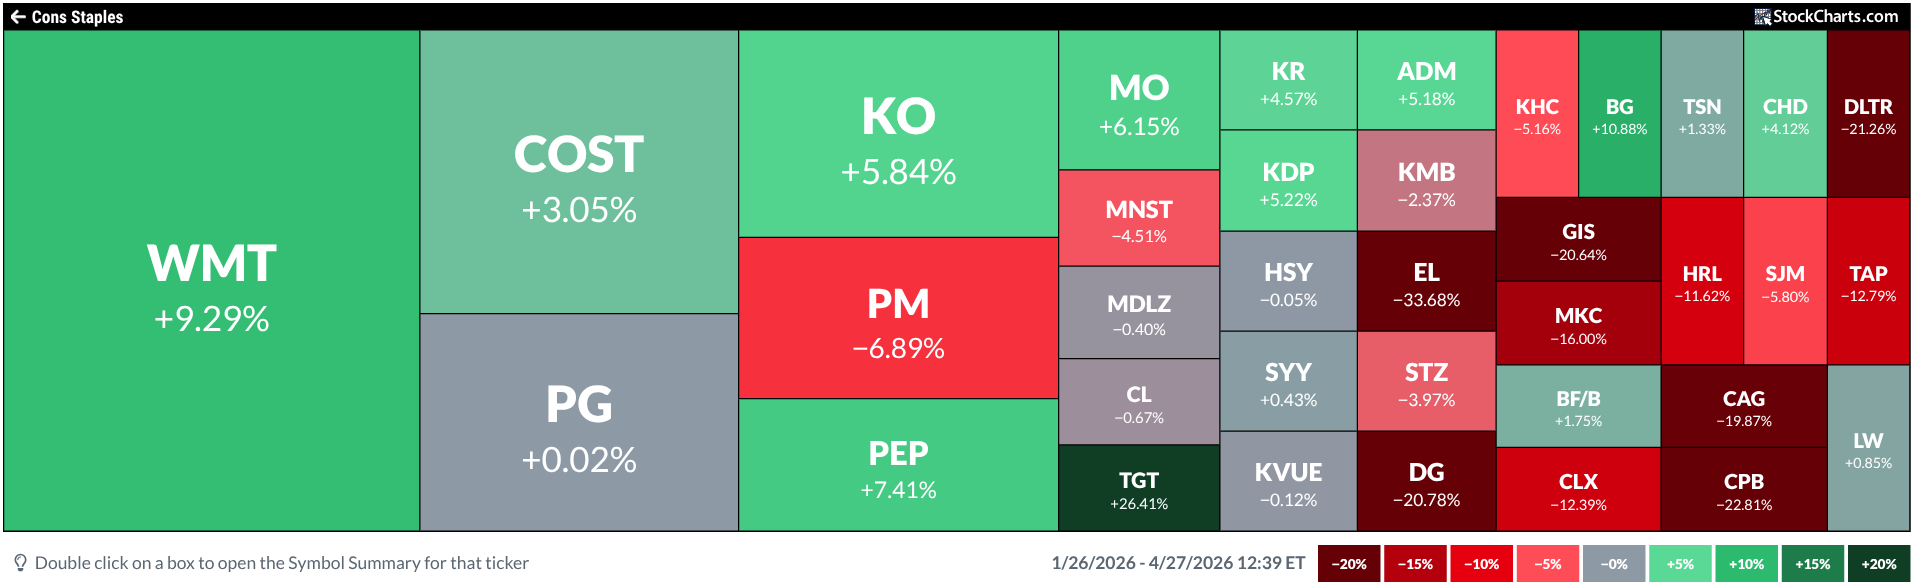
And the 6-month is even stronger than the last.
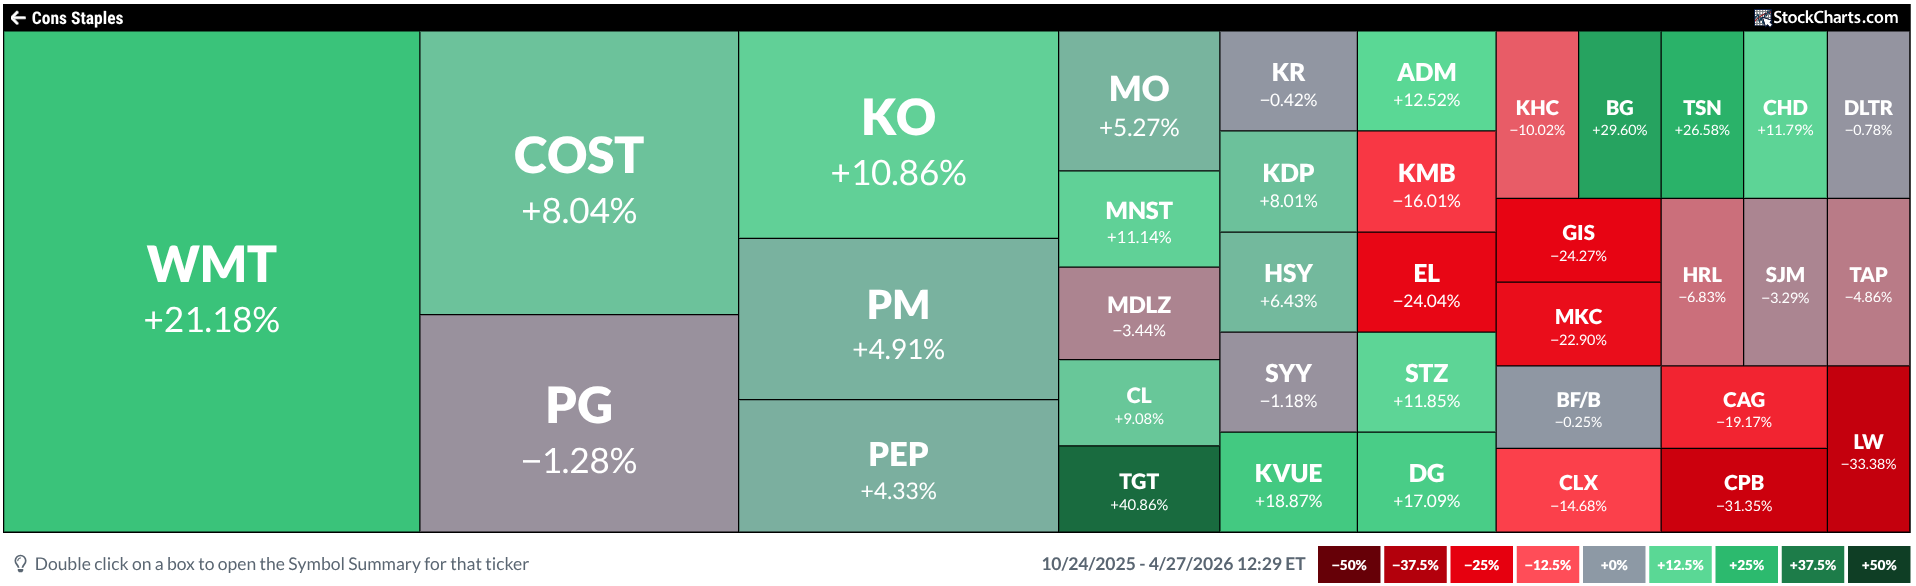
So what's going on? Is WMT slowing down? The shorter-term picture looks mixed, while the longer-term trend still holds up. This is where things can get a bit messy. So, it’s best to look at the chart from this point on.
Insider Tip #3: Look for alignment across timeframes. An improving 5D + 1M signals strength (in performance or SCTR). A rising 3M + 6M indicates that a trend may be stabilizing or building.
Step 4: Drill into charts
Here’s what you want to know:
- Is price actually trending?
- Is it holding key levels?
- Is momentum supportive?
SCTR may tell you who’s leading, but it won’t tell you how it's leading. In other words, a strong rank without strong structure makes for a vulnerable position.
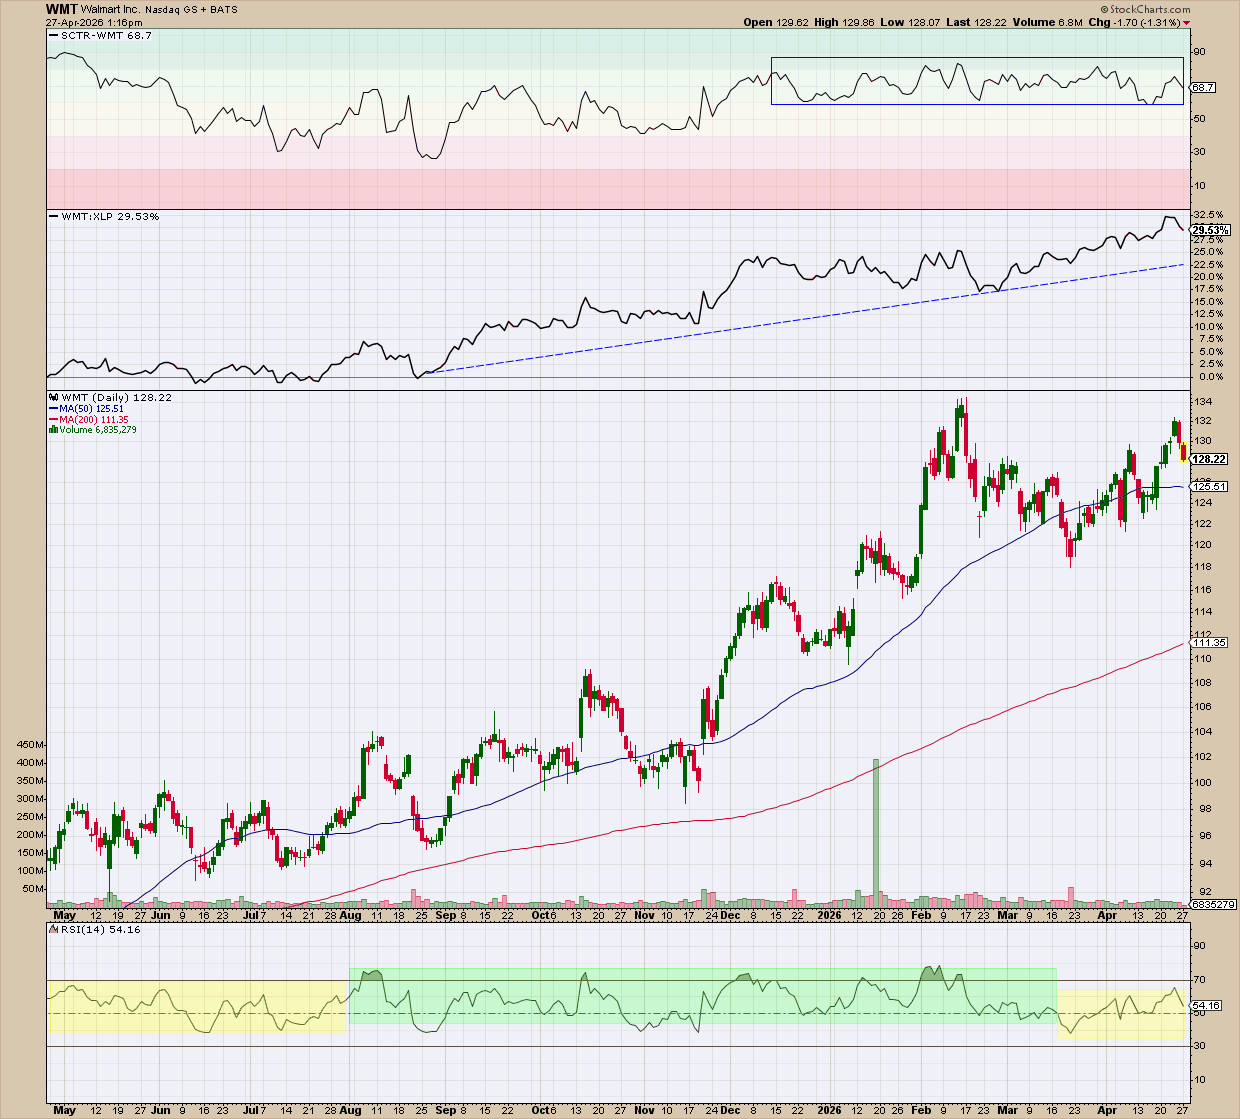
Now the picture is at its clearest. WMT has been outperforming its sector (over 29%) based on the relative performance ratio, but its SCTR is stuck in a churn zone of 60–80. Price peaked at $134 before pulling back and bouncing at $118. But is it going to get stuck in a range, or does it have enough momentum to rise above its current highs?
The Relative Strength Index (RSI) is key here. Take a look at the RSI panel. The green-shaded areas show a bullish RSI range while the yellow highlights periods of consolidation. If WMT challenges the $134 level, an RSI range of 50 to 70+ would confirm that momentum may be supporting the move.
So, is WMT an emerging leader? Not yet… BUT you can see the context in which it might (or might not). If it does emerge, you’re now prepared for it.
But my point here isn’t about WMT. It’s about using MarketCarpet + SCTR as a discovery engine. Now, try it for yourself and see what you can come up with.
Insider Tip #4: Leadership is relative, even within leaders. You probably know this, but it’s worth mentioning again. Two strong stocks aren’t equal. The one that’s outperforming tends to attract more capital which, in turn, drives it to lead the move. But because you can’t really predict the outcome, you need to look at the overall structure plus a few indicators to find the key conditions that’ll validate your bullish thesis.
And That’s a Wrap
MarketCarpets are a heat map. But their enhanced functionalities also make them a fast lane for spotting leaders at a glance. Paired with SCTR, you can find sector-wide strength and begin drilling down on potential leaders. Sure, you can always go with the biggest winners, but catching stocks on the way up, before they top the rankings, can give you an advantage. Yes, it takes more work. But if you can turn this into an efficient and repeatable workflow, then you’ve gained yet another effective avenue for buying low and selling high.