The Dollar Breakout Is Here. What It Means for Stocks, Bonds, and Commodities
Key Takeaways
- The greenback hurdled key resistance following a hawkish Fed meeting last week.
- Intermarket relationships should guide investors, but eyebrow-raising price trends have already emerged amid the dollar breakout.
- International stocks are strong, homebuilders posted a three-month high, while commodities continue rolling over.
Fed Chair Kevin Warsh kept it short and sweet in his debut press conference following last week’s FOMC interest rate decision.
Stocks wobbled, the yield curve bear-flattened, and the dollar soared as the new Fed chief made it clear that he and the 11 other voting members were sternly focused on the inflation side of the committee’s dual mandate.
‘The Reaction to the Reaction’ Matters Most
From a market perspective, it’s important to gauge the secondary reactions and intermarket ripple effects from macro events, such as the Fed. It’s not so much the policy pivot that matters, but how traders respond to it (much like corporate earnings reports).
The 2-year yield shot higher, posting its biggest “hike” in several months, while the S&P 500 ($SPX) recovered a chunk of its Fed Day losses ahead of the long weekend. Oil and other commodities, meanwhile, seemed to take their cue from developments in the Middle East.
The Dollar Makes Its Presence Known
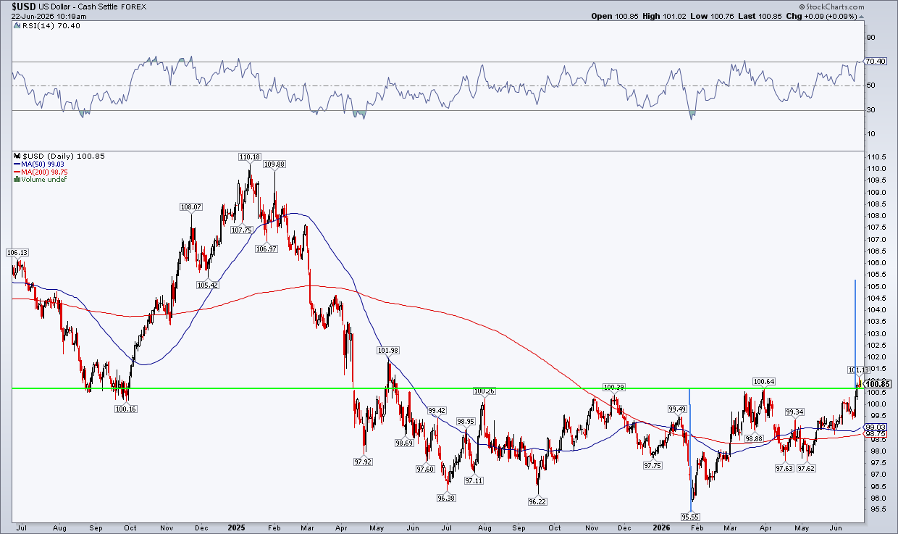
But the currency space moved decisively. The US Dollar Index ($USD) ripped through the 100.60 resistance level that I have called out a few times since late last year. By the start of trading on Monday, the greenback had built upon its gains. Dollar strength was most evident in the $USDJPY pair, which rose to its best mark in 40 years.
So, while it still may be the summer of small-cap value, traders might also grapple with mid-year dollar strength. What does that mean for other asset classes and overall risk sentiment? Let’s check it out.
A Breakout That Was Quarters in the Making
For starters, $USD’s Wednesday gain was impressive, but the dollar bulls had to stick the landing with a Thursday close above the noted resistance spot. They did that, and we now see a measured move upside price objective to near 105.50. Five handles of further upside would have significant implications, and traders must remember that we are still in an “inflationary” regime until price action proves otherwise.
That means stocks and bonds often move together, while commodities are thought to move inversely to the $USD. Of course, the last few years have featured long-lived bouts of positive commodity-dollar correlations, which go to show that these relationships are guideposts, not gospel.
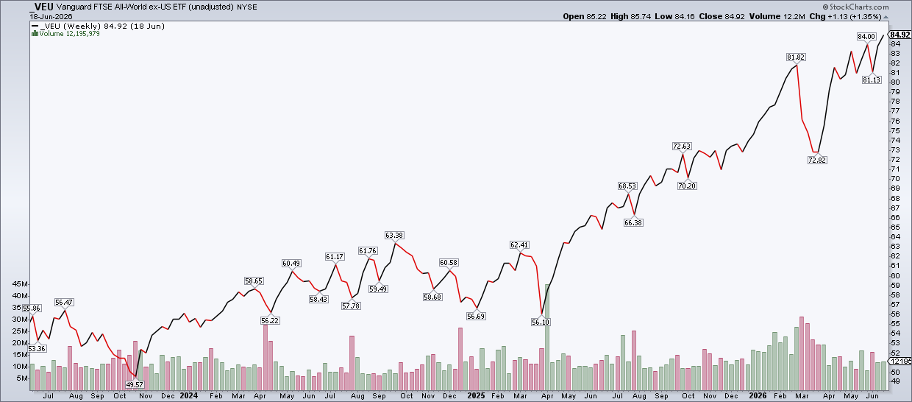
Foreign Stocks Scoff at the Dollar, Notch New Records
Another intermarket development countering typical dollar-strength periods is last week’s record weekly closing high in foreign stocks. The Vanguard FTSE All-World ex-US ETF (VEU) has quietly outperformed the Vanguard Total Stock Market ETF (VTI) over the past few weeks, helped in large part by enduring strength in South Korean and Taiwanese equities (and the AI trade).
So, that’s another global wildcard that, for the moment, overwhelms typical strong-dollar intermarket tendencies.
Overweight US Equities Should be the Bias
Ultimately, I assert that a multi-month, five-percentage-point rise in the $USD will win out. It’s like a massive ship carving its way through a channel (or strait). Amid this powerful currency force, overweighting domestic stocks is the most logical asset-allocation play.
The greenback’s gain might also argue for rising short-term interest rates and a further flattening of the yield curve. That might not be the most constructive environment for money-center and regional banks, homebuilders, or REITs.
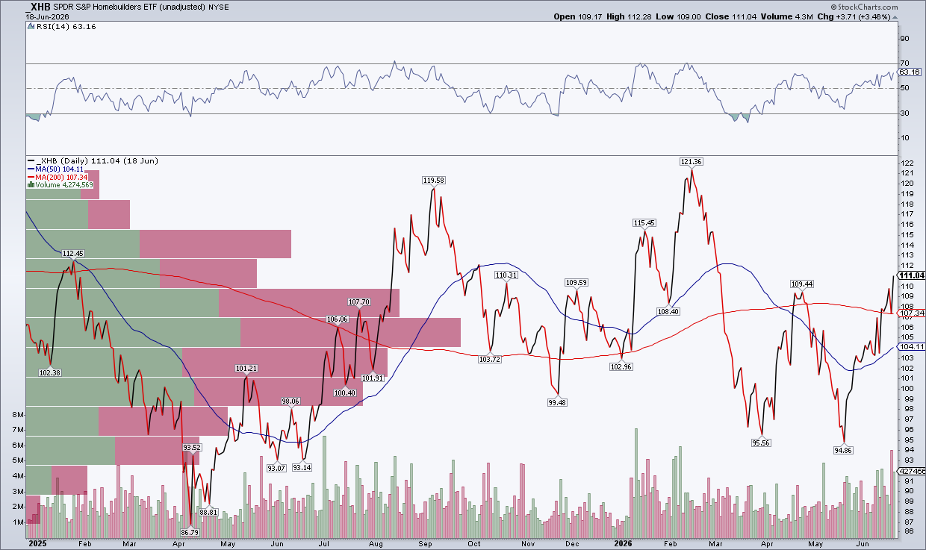
Dollar and Rate-Sensitive Niches Holding Their Own
Among those three groups, the SPDR S&P Homebuilders ETF (XHB) stands out, printing a fresh three-month high close last Thursday. Despite still-elevated mortgage rates, the equal-weight basket of domestic homebuilders shows impressive absolute and recent relative strength.
The longer-term view for regional banks is also constructive, while the Real Estate Select Sector SPDR Fund (XLRE) was hit hard post-FOMC following a multi-year high earlier in the month.
Commodities Feel the Pressure
Over in commodities, precious metals struggled as the dollar scaled YTD highs. Gold remains below its long-term 200-day moving average and is in the red for the year. Silver, despite solid GDP growth at home and abroad, has also been weak, though it has attracted dip buyers in the low $60s. Copper, which is most exposed to economic growth trends, holds firm near its record high.
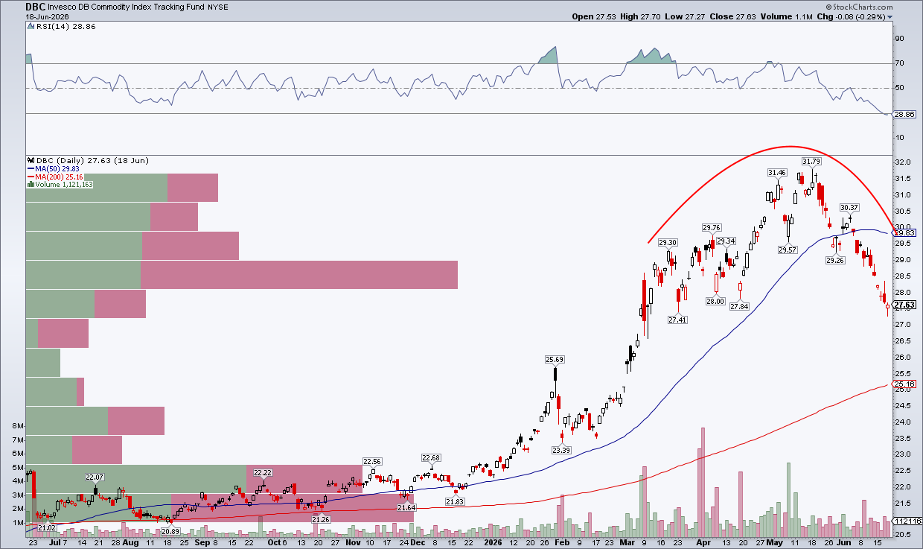
Big picture, though, the Invesco DB Commodity Index Tracking Fund (DBC) has broken its rate of trend, tagging its weakest RSI momentum reading since April 2025. A ripping dollar could add to DBC’s current 13% drawdown.
A 90’s Redux?
All told, the dollar’s breakout hasn’t been the dominant factor in intermarket price action, but I think it will steer subtle trends over the next few months. 100.60 was resistance, and it should now be support.
Another scenario is the 1990s analog, in which dollar strength is merely a byproduct of tech-led economic growth in the US. Perhaps Chair Warsh and the Fed will be forced to keep rates elevated as the job market tightens and corporate profit growth keeps humming along.
The Bottom Line
All options are on the table. For now, the dollar’s advance appears to be more bullish than bearish for stocks. Rate-sensitive areas are hanging in there, while sectors that are notoriously weak when the buck bounces are outperforming. As with Treasury yields, it’s not just the $USD’s direction that matters, but also its speed and level. For now, risk assets appear to tolerate the slightly firmer dollar.
Curious about the trends shaping today's market? Visit our Articles & Videos page and keep your learning going.
Disclaimer: This blog is for educational purposes only and should not be construed as financial advice. The ideas and strategies should never be used without first assessing your own personal and financial situation, or without consulting a financial professional.