StockCharts Insider: The Anatomy of a Trading Setup
Before We Dive In…
You’ve done your research. You’ve identified the instruments you want to trade. And now you’re ready to pull the trigger. At this point, you can easily jump the bridge between commitment and action. But the smartest way to go about it is to run through all the necessary steps to ensure your trade is well-managed and your losses are kept in check. In short, build a setup.
Yes, it seems basic. But many people tend to skip this phase, ending up with either a much bigger profit than expected (leading to a future surprise loss) or just a whopping loss. So, if you’re not familiar with the basics of a trading setup, let’s go ahead and cover them. Once you finish learning this material, you’ll never have to go back to it again.
The Anatomy of a Trading Setup
The logic is pretty straightforward. You want to know where to get in, where to exit if things go right (unless you’re a buy-and-hold investor), where to bail if things go sour, and most importantly, how much money to use to max your profits while minimizing your losses.
You’ll probably want to add to or reduce your exposure in the future as well, but that’s another setup entirely (we’ll cover that later). To formalize the process a bit, think of it in this way:
- Entry point: This is where you get in (a breakout, bounce, a reversal bar, etc.).
- Stop level: This is where you bail if your thesis proves to be wrong.
- Target: This is where you take profit.
- Reward-to-risk: This is where you figure out your risk relative to profit goals.
- Position size: This is where you optimize the amount of capital you’re risking (like 1% or 2% risk per trade; the wider your stop level, the smaller your position size).
Before we continue, let me lay out some of the biggest mistakes people make in this process.
Mistake #1 is not doing any of this. It’s like going on a hike in new terrain without bringing your basic necessities or preparing physically or mentally for the endeavor. Not a smart combo.
Mistake #2 is skipping the last two steps of the setup process. Imagine a successful trade where you barely made anything because your position was too small. Or imagine getting stopped out and having most of your trading money depleted because your position was too large.
There are other mistakes, but these two are probably the biggest ones.
Trading Setup Examples
Suppose you have $10,000 to trade.
1 - Breakout Trade
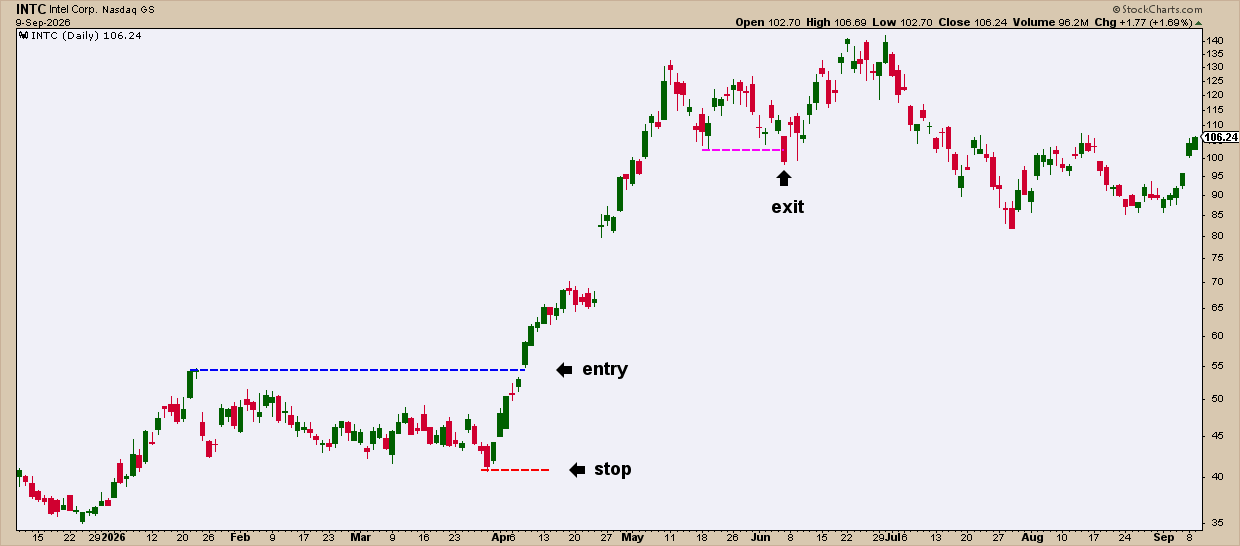
Breakout trade example - INTC
You’ve been eying Intel Corp. (INTC) since it began consolidating in January. You decided to buy once the stock breaks above its January swing high at $54.60. Here’s how you might have built your setup.
- Entry point: $54.65 using a buy stop order (see dotted blue line)
- Stop level: $40.60 as you figured if it retests this support level, the lack of momentum would invalidate your bias (see dotted red line).
- Target: Since you’re expecting an upward move on strong momentum, you don’t set a specific target. Your take-profit rule is to let the upswing complete itself and exit upon a retest of the higher swing low (which turned out to be $102.40, marked by the dotted magenta line).
- Reward-to-risk: Since you didn’t specify a target, you can only calculate your risk-per-share which is $14.05 from entry to stop.
- Position size: You decide to risk 2% on this trade. That would mean a risk of $200. By the way, I treated this subject in greater depth in this article here. Dividing your risk-per-trade by your risk-per-share tells you exactly how many shares you can hold in your position. In this case, $200 divided by $14.05 = 14 shares. So that’s your max position. You get stopped out, your loss will be $196.70 not counting any commissions fees or other trading costs. I’d say that’s well managed.
The outcome if you took this trade following the rules above would have been a profit of $47.75 per share, or $668.50 when multiplied by 14 to approximate your position. That’s over a 3-to-1 reward to risk.
2 - Fibonacci retracement setup
You often hear experts on financial news telling you to buy the dip. Sometimes they’ll even mention prices that they think are good for entry. But unless you have a more objective way of doing this, you’ll always feel like you’re buying a potential “falling knife.”
Fibonacci retracements are an effective way to measure dips, because they give you clean entry and exit points (stop levels).
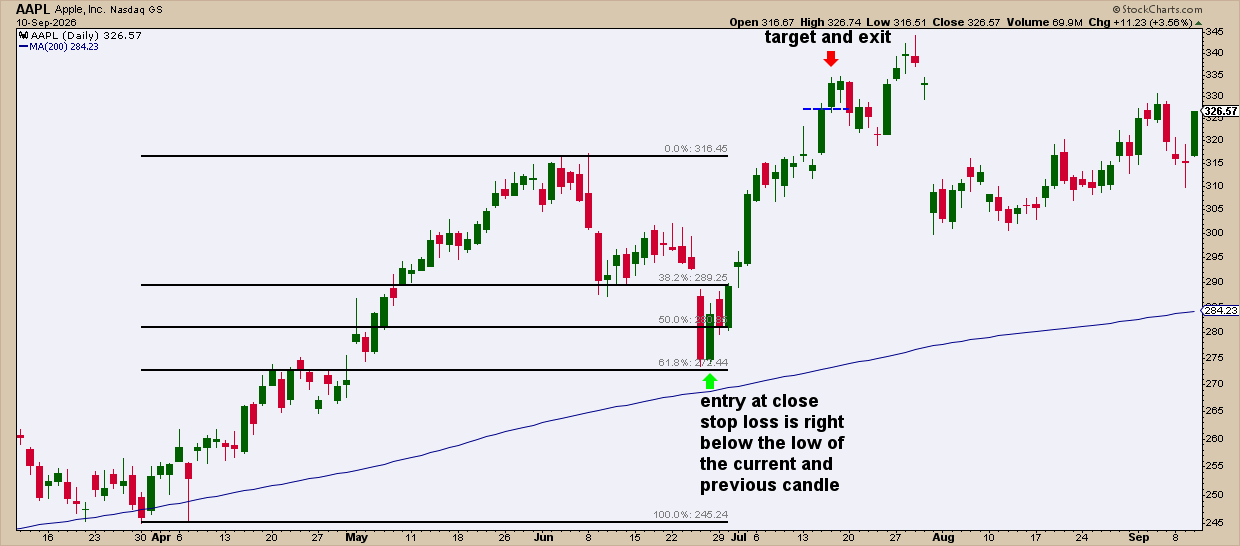
Fibonacci retracement setup example.
In this example, you see Apple, Inc. (AAPL) pulling back in June. Using a Fibonacci retracement tool from the April trough to the June peak, you hope to enter a position on a reversal candle after falling to either 50% or 61.8%. AAPL falls to 61.8% and reverses. Now, a quick setup.
- Entry point: $283.54
- Stop level: $272.40
- Target: $327.21 is 75% of a measured move of the height of the entire swing (peak to trough) that’s been added to the actual low that nearly touched the 61.8% retracement line.
- Reward-to-risk: 3.9-to-1 as you'd capture a profit per share of $43.67 for a risk per share of $11.14.
- Position size: 17 shares ($200 divided by 11.14 = 17.95). If you got stopped out, your loss would be $189.38.
In this hypothetical case, the trade worked out. Now, trades don’t always work out and you will get stopped out. But your loss would be anticipated and manageable due to the setup. Without a proper setup, your outcome across many trades would be all over the place.
After a couple of examples, I think you get the point. Now, a few Insider Tips to go with it.
Insider Tip #1: A missed entry isn't a loss. It just means you have to recalculate.
Say you want to enter a stock position at $50, with a stop at $40. You want to buy and hold. This means there’s no target. But, you care about your thesis being wrong. Hence the stop loss. With a max risk of $200 per trade, that $10-per-share risk caps you at 20 shares ($200 ÷ $10 = 20).
Suppose you missed your entry. You weren’t paying attention for a few days and the stock shot up to $60. However, $40 is still your best stop level. It’s not a broken setup. Just resize the position. At $200 divided by $20, your position drops to 10 shares. Same $200 cap. It’s now just fewer shares to make up for the wider risk.
Insider Tip #2: Adding to a position isn't free upside. It’s a whole new setup.
Your first trade is working well. The stock pulls back again and you have an opportunity to add to your position. Now, it’s a completely new setup. Are you going to risk the same amount, go lighter, or go heavier? Whatever you decide, treat this as a new trade. And if your original entry point is still close, meaning you might lose some profit or take a smaller loss if you get stopped out, you will have to take that position into consideration.
Insider Tip #3: Two setups on correlated stocks aren't two setups.
If you’re creating setups on both MU and AMD (semiconductors), or JPM and BAC (banks), or XOM and CVX (energy), you may be managing trades on two different companies, but depending on your portfolio diversification strategy, they’re almost the same trade.
Position sizing logic assumes each trade is relatively independent. Correlated positions are not. So, if you’re trading with a risk of 2% per position, two correlated stocks can easily double your losses to 4%. If you’re trading correlated stocks, maybe you ought to treat both as a single trade, reducing your risk to 1% per position instead. This way, if you get stopped out, your maximum loss would be capped at around 2%.
And That’s a Wrap
Every trade you place, no matter the market or situation, all comes down to five questions: where are you getting in, where’s your target (if applicable), where are you closing out if you’re wrong, how much risk are you taking relative to reward, and how large of a position will you take? That’s the anatomy of a setup. Make it a habit. It’ll build competency and, over time, trust in the way you handle different markets. That’s your simple Insider lesson for today.