StockCharts Insider: The 'Beginner's Guide' That Skips the Basics and Gets to What Matters Most
Before We Dive In…
You’ve likely seen or read plenty of “how-to” guides for investing. There are tons of them out there. Few are comprehensive; too many angles to cover, so many details. Most “basic guides” repeat the same info. And why not? Basics are basics. Basics don’t change.
This is also a beginner’s guide to investing—but with a twist. It’s not aiming to cover everything you need to know. That’s just impossible. Instead, it presents a simple path, one that leads to important knowledge, resources, and tools to get started.
More importantly, this guide tells you something most others won't: fundamental and technical analysis aren't opposing approaches. They're two lenses on the same stock. You need both. Sometimes those two lenses agree. Sometimes they don't.
That gap, where a business and a chart face off... that’s where the real opportunities are to be found. That's where we're headed.
How to Read a Company and Its Chart
A 10-Second Gut Check: What’s Your Time Horizon?
One question to ask yourself: are you planning to hold for weeks, months, or years? Maybe it’s a combination of all three, depending on the stock.
It’s important to figure this out because your horizon decides how much you should lean on fundamentals or technicals. With a long horizon, you need to spend more time on a company’s fundamentals. (i.e. is this a business you’d want to own?) Meanwhile, with a short horizon, the technical lens is critical (i.e. is this the best time to buy and, if not, when and at what price?).
In both cases, you're still analyzing the company’s economics and price dynamics. But the weight of each angle changes based on your time horizon.
One Stock, Two Questions
Let's say you’re interested in Sandisk Corp. (SNDK). People have been talking about SNDK over the past year. Now you want in, but you’re worried you’re too late. Are you? It depends on your time horizon (remember?).
You need to ask two basic questions:
- Fundamentals: Is this a healthy business at a fair price?
- Technicals: Is price action confirming or going against this read on fundamentals?
We'll start with the first. Please note that you can find fundamental data in the StockCharts Symbol Summary page.
Lens One - The Fundamental Read
There are three things that every investor should know before pulling the trigger.
Is this a real business?
Start with this key question, and break it down further. What’s the business' earnings-per-share (EPS)? When’s the next earnings date? Does it offer dividends? Is the company making money, or is it reinvesting to the point where its earnings are still negative (like many tech startups have done)? Does it have enough cash flow on hand to maintain or expand the company?
All of these are questions you’ll need to ask, especially if it's a new company just getting off the ground.
Is the valuation reasonable?
What are you paying per dollar of earnings? How does a company’s current market value compare to its book value (total assets minus liabilities)? How does its market value compare to the cash it generates? Be sure to check ratios, like Price-to-Earnings (P/E), Price-to-Book, Price-to-Cash Flow, etc.
There are plenty of other valuation and liquidity ratios, but you’ll have to do some extended homework on your own to find the more detailed stuff. Assuming you want to dig that deep, that is.
Are the big players buying it?
Don’t skip this piece of information. Higher institutional ownership percentage tells you that fund managers and other major financial firms have vetted the stock. They’re what Wall Street calls the “smart money.” These big players won’t buy unless they have confidence in the company’s long-term potential. They also bring some price stability and market liquidity to the table.
Going back to our SNDK example, let’s run through this process.
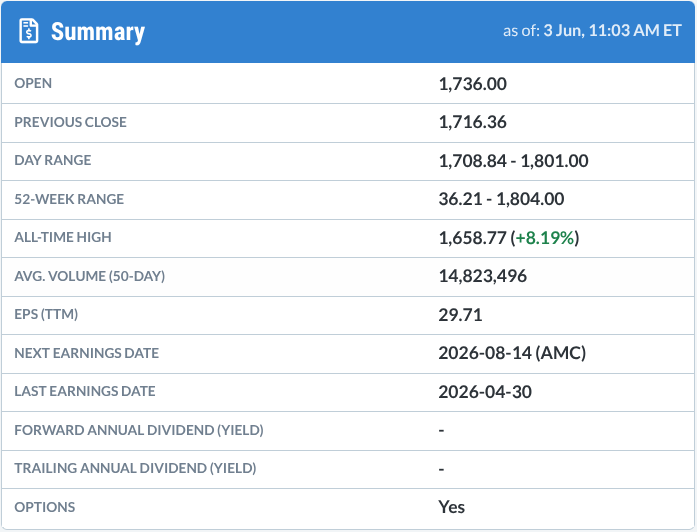
The first window of the summary gives you basic information. Here’s where you can check the stock’s price, average trading volume, earnings-per-share (EPS), dividend info, and more. After this, you’ll want to drill down to other important figures.
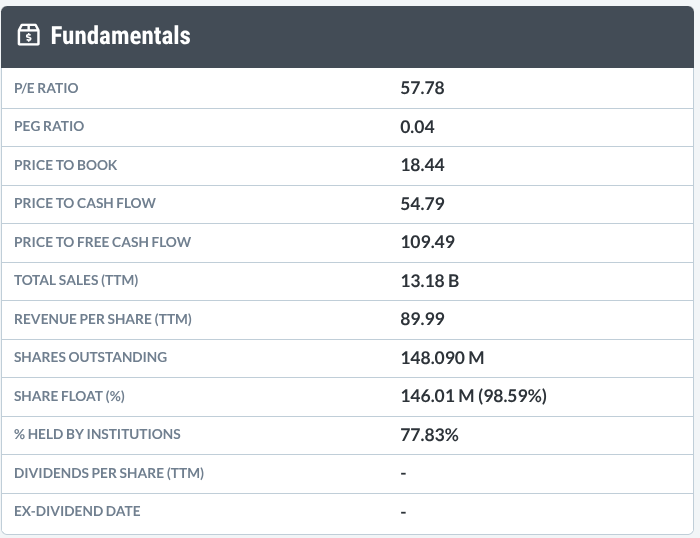
Here’s where you can find basic valuation criteria like the P/E Ratio, Price-to-Book, Cash Flow, shares outstanding, percent held by institutions, more dividend info, and other fundamental figures. You can also find the % held by institutions here. In the case of SNDK, it's almost 78% at the time of writing, a reasonably high figure.
If you need additional data, you’ll have to do more research. For many investors, though, this paints an adequate picture of the strength of the company.
Next, check SNDK’s revenue and earnings picture.
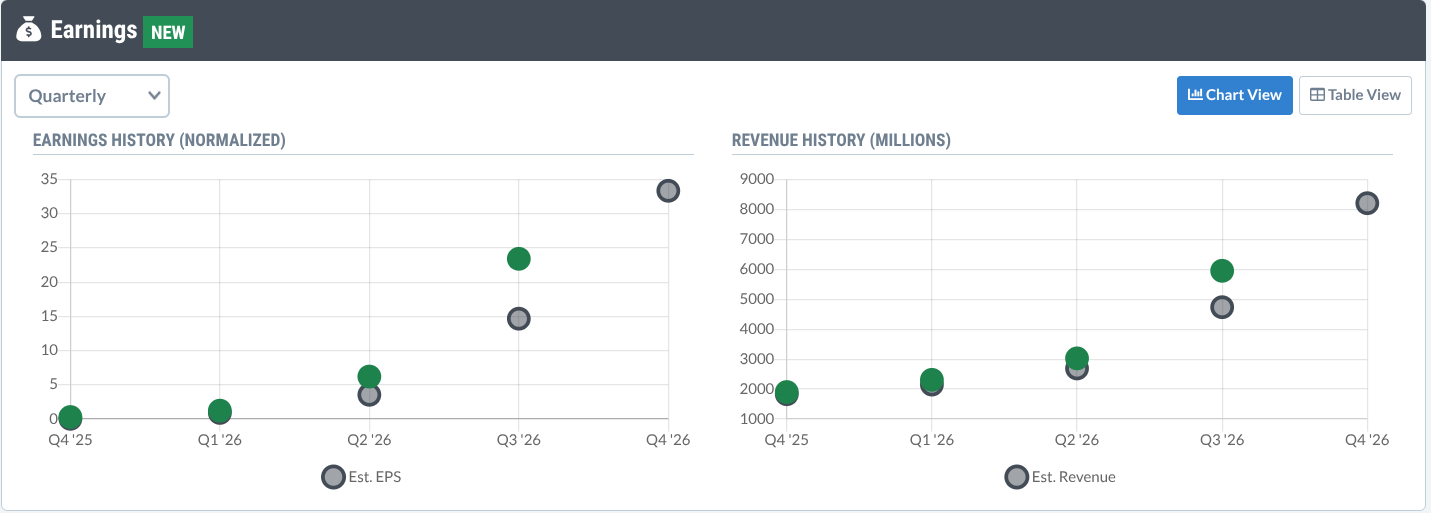
SNDK beat both top and bottom lines over the two most recent quarters. Prior to that, it matched analyst expectations.
So you now have to fill in the blanks: “The business looks __ and the price/valuation looks __ and 77.8% of shares are held by institutions.”
If it looks promising, you move to the next lens—the technical picture.
Lens Two - The Technical Read
A company can be strong but not be in the best position to buy. Timing the market fundamentally is tough, but timing it technically is just called “fine-tuning” your entry.
If you’re mainly a fundamental investor, technicals can help you fine tune the tactical angles of timing and execution. If you’re not familiar with technical analysis, check out this easy-to-read tutorial on John Murphy’s 10 Laws of Technical Trading.
Is the stock trending?
It's time for some more important questions. Is the stock trending up, down, or moving sideways? If it’s trending up, where’s the best place to buy and place a stop-loss? If it’s trending down or merely pulling back, where is it likely to bounce? If it’s moving sideways, chopping up and down, where are more buyers likely to place their buy orders and stop-losses?
Is the crowd actually showing up?
By “crowd,” are we talking bulls or bears? Is there strong momentum and volume behind the move? Is there more buying pressure or selling pressure driving or accumulating behind the price? There are lots of tools to gauge this and more.
One strength read to sum it up - SCTR
Is this stock technically strong relative to its peers? Is its collective technical strength outranking 70%, 80%, or 90% or more of stocks trading in the U.S.?
Here’s one read that’ll give it to you: the StockCharts Technical Rank (SCTR, or “scooter” for short). This measures a stock relative to others using several technical indicators across various timeframes.
Let’s go back to the Symbol Summary. This time we’re looking at technicals.
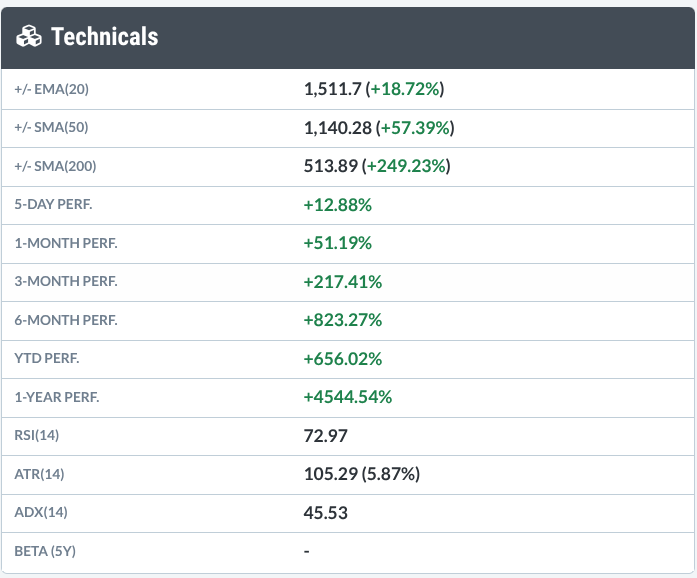
This gives you basic moving average, performance, and trend, momentum, and volatility readings. These are basic technical readings that you need to understand. Check out the Murphy tutorial series if you’re not familiar with them. Trust me on this; they’ll widen your insight into a stock’s price action.
Next, check the SCTR panel.
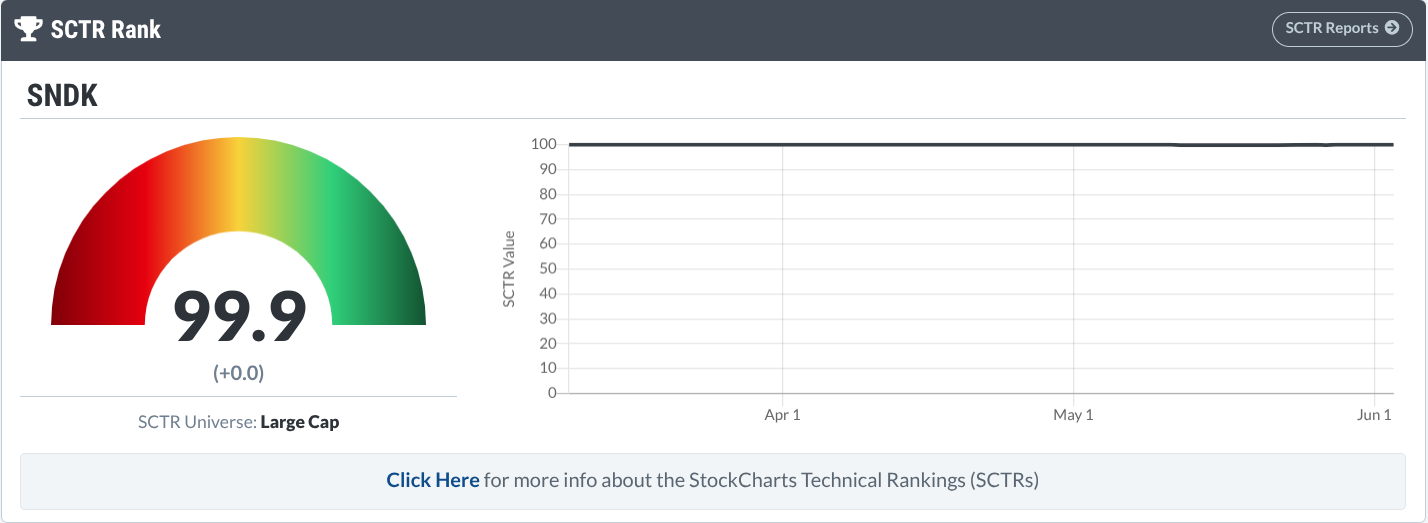
99.9 is the highest you can get, and it’s been there for months.
Technically, it’s an exceedingly strong stock at the time of writing. But has it gone too high? Is it a good time to jump in? Should you wait for a moment of weakness and buy the dip? This is where you need to look at the chart.
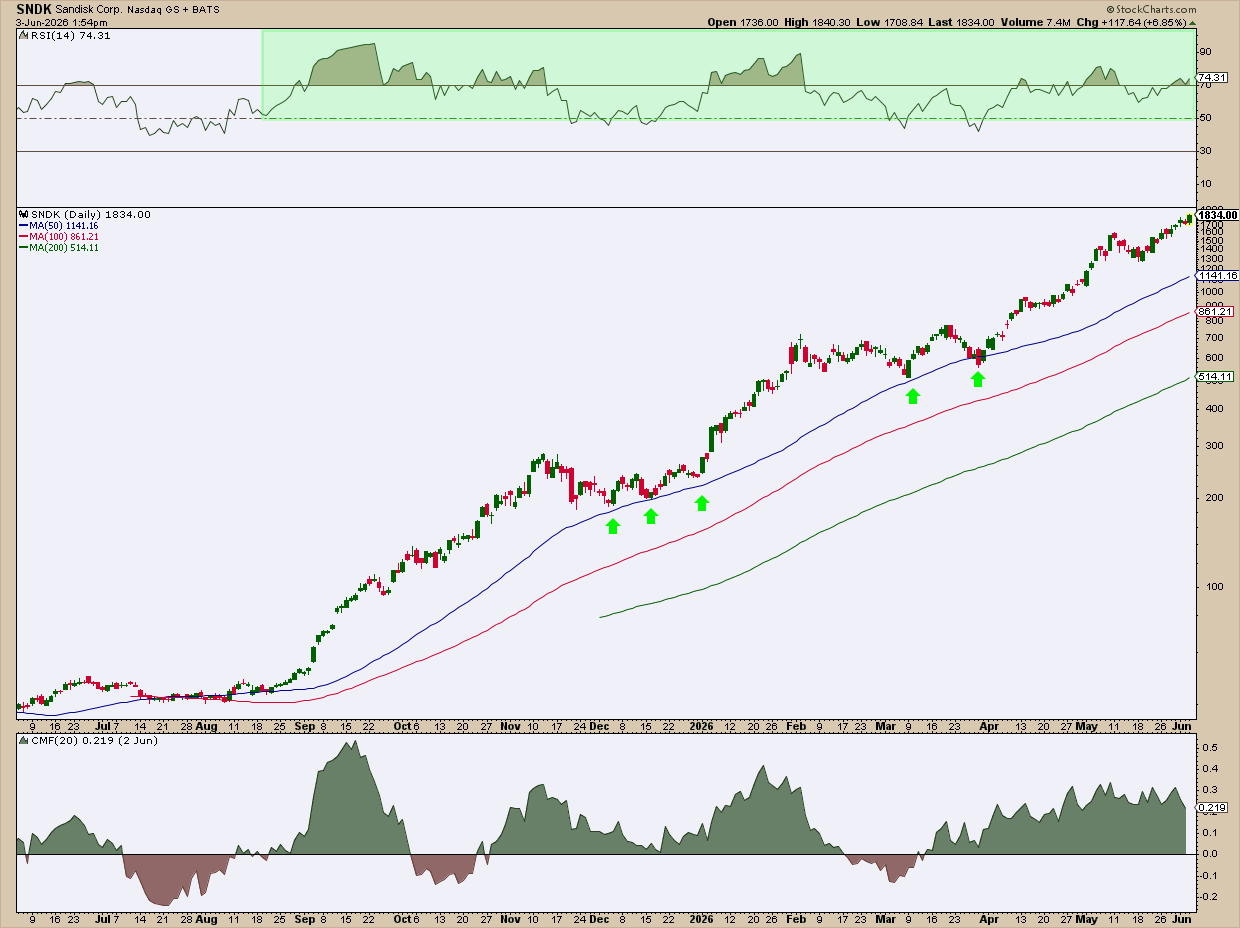
As this is for investors who are relatively new to technical analysis, I’ll keep this simple. Before we start, though, here’s a disclaimer: This is my setup. It resonates with my approach. Yours will probably be different. So, build your own chart as you go.
As of writing, SNDK has been trending up since August 2025. The 50-, 100-, and 200-day Simple Moving Averages (SMAs) are in “full sail.”
Buyers have been buying the dip every time the price pulled back to the 50-day SMA. Will that continue? Maybe. Or maybe buyers will jump in at the 100- or 200-day SMA next time. It really depends, and you have to look at other factors. But at least you can see what’s happened, and it’ll inform you when the next pullback takes place.
See the green-shaded area in the Relative Strength Index (RSI) panel? That’s a bullish RSI range. It helps to know this. Momentum is favoring SNDK. If you don’t know how this works, here’s a quick explanation.
I also plotted the Chaikin Money Flow (CMF). It tells me if capital is flowing into or out of the stock. Above zero means buying pressure; bulls are in control. Below zero menas selling pressure; bears hijacked the momentum.
The Four Equations That Tell You What a Stock Is Really Saying
You've got two lenses. Fundamentals. Technicals. When they meet, there are only four possible outcomes. Think of them as equations.
1 - Strong fundamentals + strong technicals = confirmation
The business is solid. The crowd is already buying. The story and price agree. This is the cleanest entry. Not always the cheapest, however. So, fine-tune your entry on a chart. This equation is the lowest-confusion scenario for a trade.
2 - Strong fundamentals + weak technicals = early advantage or early warning
Good business, but now you have to wonder. Either you see something that the market hasn’t noticed yet or the market knows something you don't.
This is where most beginners make mistakes. They assume the chart will catch up to the fundamental story. Sometimes it does. Sometimes there's a reason it hasn't. Dig deeper into it before you decide.
3 - Weak fundamentals + strong technicals = caution
Price is soaring. Momentum is strong. But the underlying business case doesn't support it. Could this be hype territory? Is this a meme stock? Not always.
Turnarounds happen. Narratives shift. But tread carefully. Know why the crowd is buying before you follow them in.
4 - Weak fundamentals + weak technicals = easy pass
Bad financials. Bad chart. Nothing to see here. Move on.
One last thing. The equation isn’t a trading signal. Not quite. It brings you to another set of questions. Those questions depend on your time horizon. Are you thinking weeks or years?
The same stock can sit in different boxes for different investors. That's not a flaw in the system. That's how it’s supposed to work. But will the investment work? That’s your task. You have to make it work by making the right decisions, and know how to get out of it and move on to better opportunities if it doesn’t.
And That’s a Wrap
I told you this was a tutorial with a twist. I skipped the common stuff that you can, and should, do on your own, and now you have a process. A workflow.
It really boils down to two questions: Is the business worth owning, and does the price action present an advantage? On a general scale, that’s the whole game. There are more nuanced questions, of course, but you’ll encounter those as you gain more experience.
Last thing. The goal isn’t certainty. Guarantees don’t exist in this game. There’s no predicting. Humans are particularly bad at predicting the future. The goal isn't to be right. It's to be in positions where being right pays big and being wrong costs little.