The S&P 500 Just Broke Its 200-Day Moving Average. Now What?

The S&P 500 broke below its 200-day moving average this week, appearing to confirm the ongoing distribution phase for the major US equity benchmark. While the severity of this breakdown and the aggressive follow-through on Friday may have caught investors off guard, a consistent review of moving averages has already been keeping us super cautious this month.
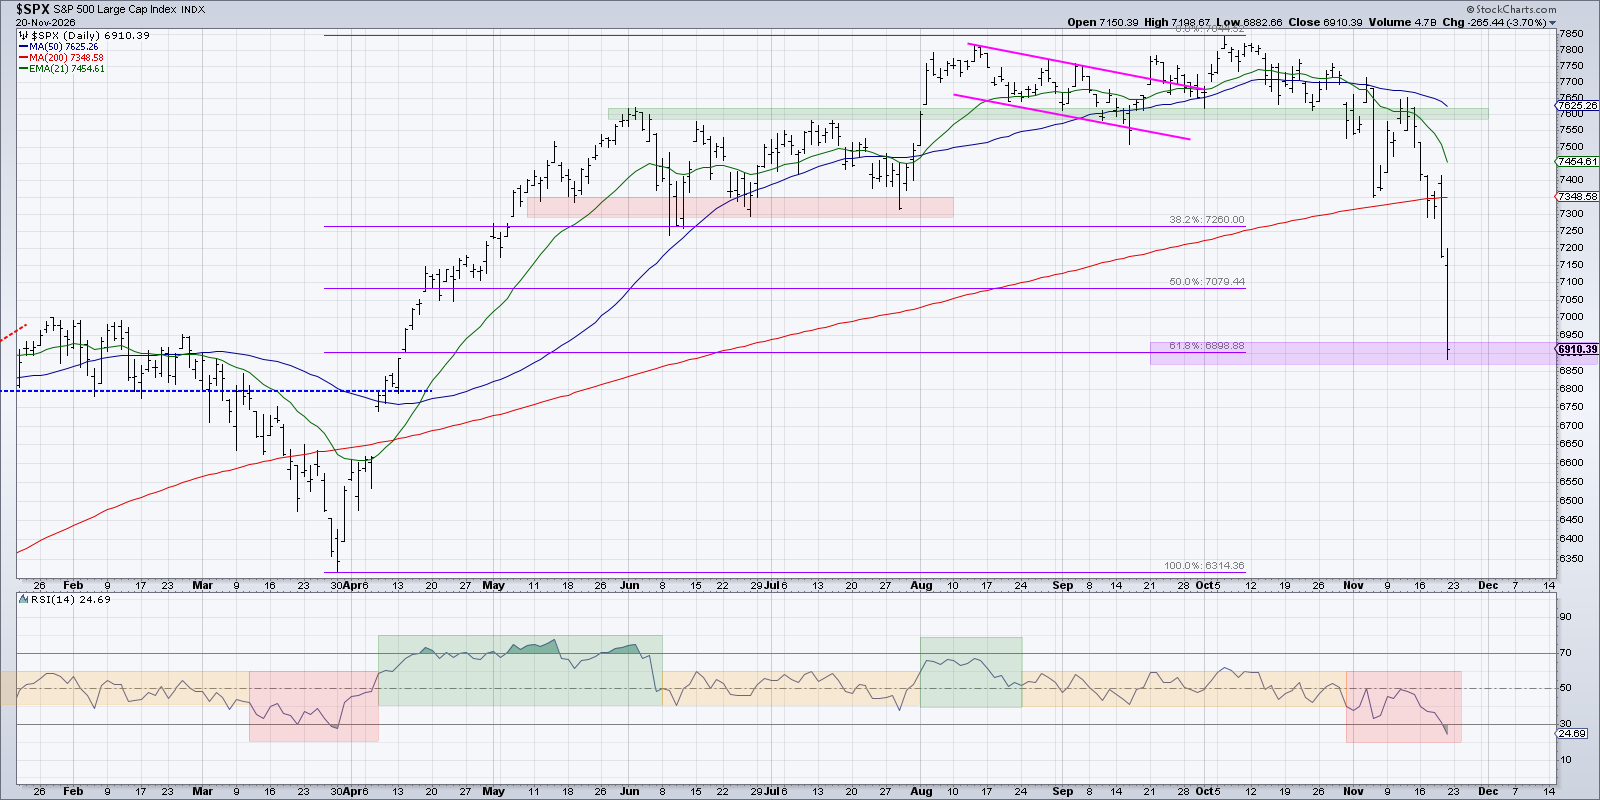
Once the SPX 7600 level was broken at the end of October, we laid out a potential countertrend rally to previous support. As we covered on our daily market recap show, the countertrend rally played out pretty well, leading to this week’s test and failure at the 200-day moving average.
My moving average approach involves three key moving averages:
- The 21-day EMA as an initial signal of a tactical change in trend
- The 50-day SMA as a short-term support level
- The 200-day SMA as a bearish warning signal
Before a chart like the S&P 500 breaks the 200-day, it first has to break through those initial short-term moving averages. As I was taught by an early mentor, “All large losses begin as small losses.” Similar to the pullback in Q1, those early breaks of the 50-day moving average provided a fantastic warning of a further decline.
You may have noticed that the S&P 500 has reached our downside target of SPX 6900, based on a 61.8% Fibonacci retracement of the March-to-October bullish phase. Let’s dig into some moving average breadth readings to gauge the possibility of a short-term countertrend rally off support.
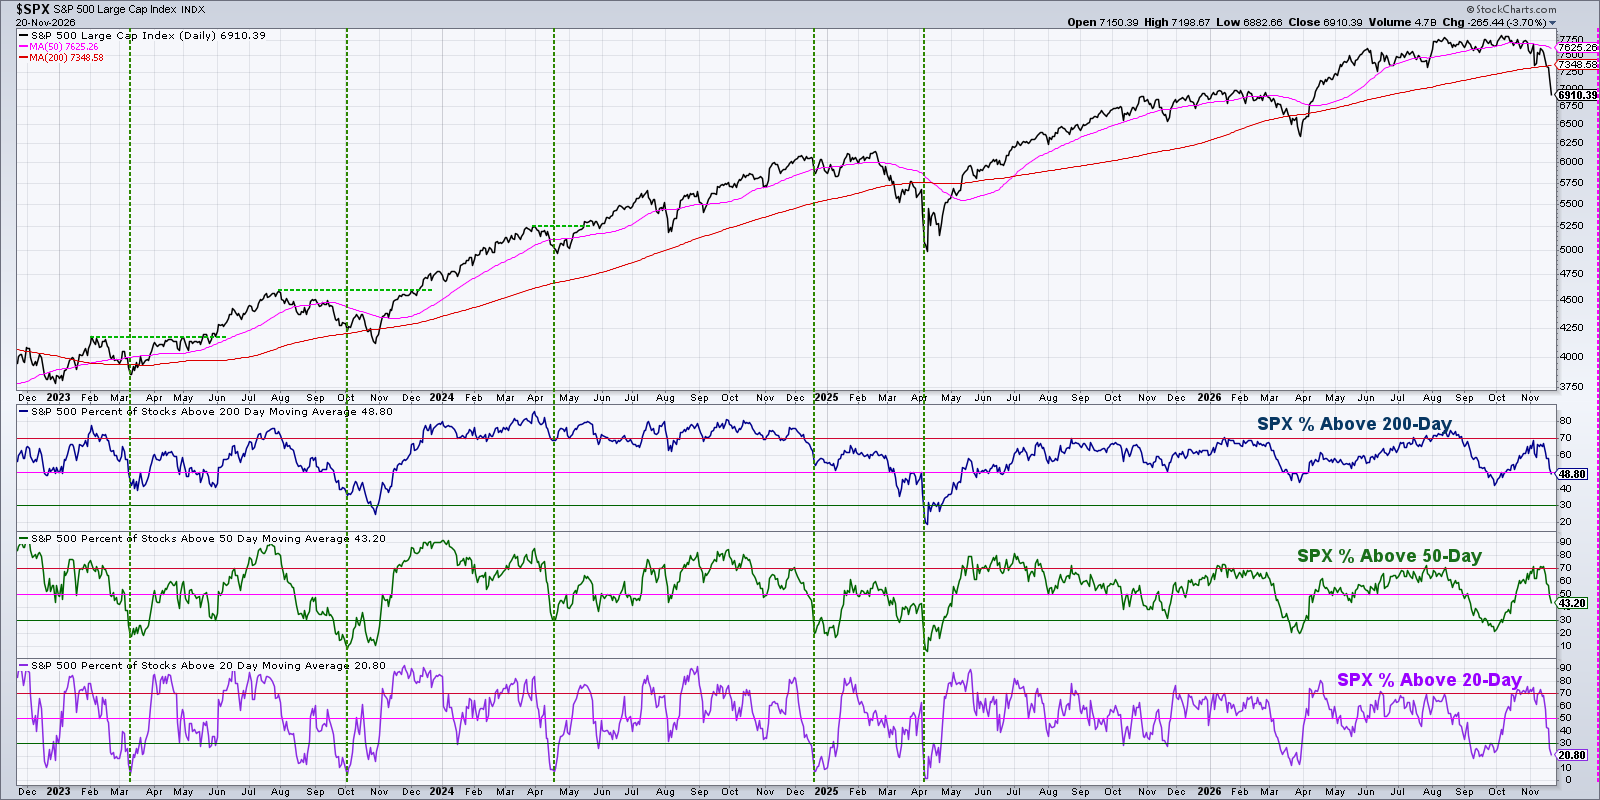
As of Friday’s close, just under 50% of S&P 500 members remained above their 200-day moving average. About 43% are above their 50-day, while only 21% sit above their 20-day moving average. Although I tend to focus more on long-term moving averages, we have to remember that strong negative readings on that last data series can often indicate a short-term countertrend bounce.
I’ve added a green vertical line every time we saw 10% of S&P 500 members above their 20-day moving average. To put it another way, this represents every time that over 90% of the S&P 500 stocks were below their 20-day moving average! That means strong negative momentum and lots of pullbacks across the board.
In every instance going back to 2022, the S&P 500 has experienced a bounce to a new swing high after this indicator got so bottomed out. And we haven’t seen a signal since the “tariff tantrum” low in April 2025. We’ll definitely be watching to see if this indicator drops below the crucial 10% level, as that could suggest a strong upswing soon after.
I also use moving averages to fuel my proprietary Market Trend Model, which defines the trend on three different time frames after the weekly close each Friday. Based on this week’s price action, our model remains bearish on the short-term and medium-term time frames, while still bullish on the long-term side.
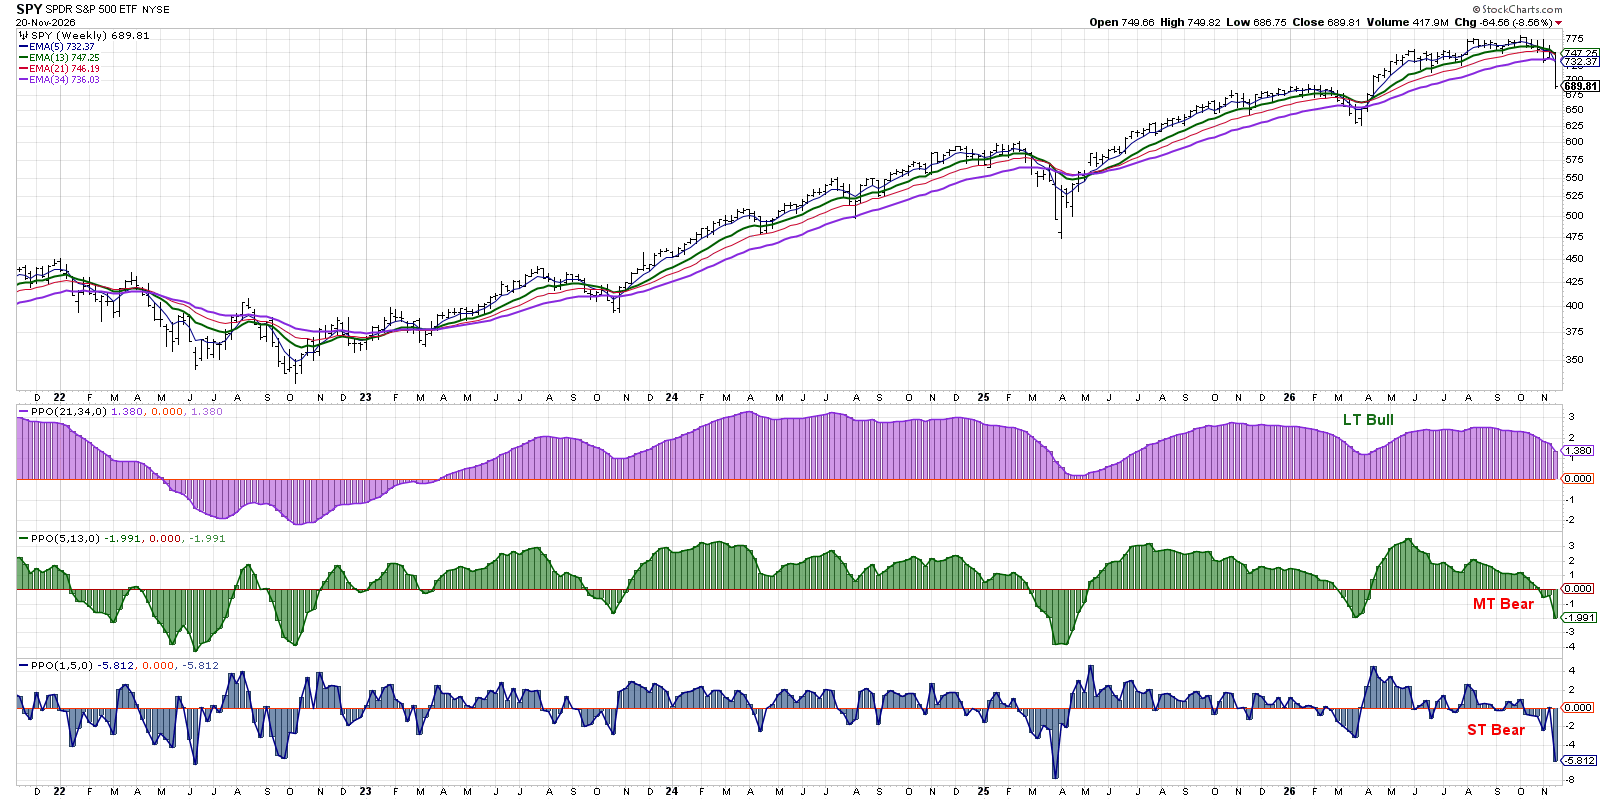
This configuration suggests that we’re in the midst of a tactical (short-term) and cyclical (medium-term) decline within a secular (long-term) bull market phase. For now, the configuration appears similar to previous pullbacks in March 2026 and March 2025. In both of those previous occurrences, we waited for the medium-term model to signal an “all clear” to help us identify a meaningful low and confirm a new uptrend phase.
Based on this week’s rapid deterioration, we see this market in a confirmed corrective move. Given the approach to key Fibonacci support, along with market breadth indicators reaching extreme low levels, we remain alert for a short-term upside reversal. But until and unless our medium-term trend model turns bullish, we’ll most likely remain skeptical and defensively minded.
By the way, we addressed these topics and a number of others in our recent webcast, The Power of Three: Using Moving Averages to Evaluate Trends, which will remain free to access through the end of November!

RR#6,
Dave
P.S. Ready to upgrade your investment process? Check out my free behavioral investing course!
David Keller, CMT
President and Chief Strategist
Sierra Alpha Research LLC
marketmisbehavior.com
https://www.youtube.com/@DKellerCMT
Disclaimer: This blog is for educational purposes only and should not be construed as financial advice. The ideas and strategies should never be used without first assessing your own personal and financial situation, or without consulting a financial professional.
The author does not have a position in mentioned securities at the time of publication. Any opinions expressed herein are solely those of the author and do not in any way represent the views or opinions of any other person or entity.