StockCharts Insider: Three Insider Tips for Using Volume-by-Price More Effectively
Before We Dive In…
You see that volume histogram beneath your chart? It holds a lot of insight. Perhaps more than you realize. But not in its default position. First, you have to rotate it. Turn it into a Volume-by-Price indicator. This gives it range across the x and y axis. And that simple shift turns a basic tool into something far more informative.
What Happens When You Verticalize Volume
The easiest and most common way to use Volume-by-Price is to view its longest bars as potential support and resistance. This is because the longest bars mark the most concentrated levels of trading activity, and they generally coincide with support and resistance. Essentially, the heavy volume confirms the concentrated price action.
But let’s take a step beyond that functionality and think of the indicator from a different perspective. Perhaps it’s more useful to think about Volume-by-Price bars as acceptance and rejection levels.
- High Volume Nodes (HVNs) are areas of acceptance
- Low Volume Nodes (LVNs) are areas of rejection
If you’re familiar with J. Steidlmayer’s Volume Profile, you’ll right away notice I’m borrowing from it. I’m intentionally drawing on some conceptual overlap while respecting the difference in concept.
By viewing it in this way—either HVNs or LVNs—you’re no longer asking “Where is support or resistance?” but instead asking “Where will price slow down or speed up?” And this shift alone will change how you interpret the entire chart. With that in mind, let’s go straight to some Insider Tips.
Insider Tip #1: Trade Behavior, Not Just Levels
Inside an HVN, especially when they’re clustered together, you can anticipate the following chop and back-and-forth rotation, as traders negotiate “fair value” price. You might favor mean reversion by anticipating support or resistance. But if price breaks out, the impulse driving the move is likely to be strong.
Between HVNs (through LVNs) you get a different scenario, where price tends to move more freely and quickly. Expect expansion, directional moves, and trend momentum.
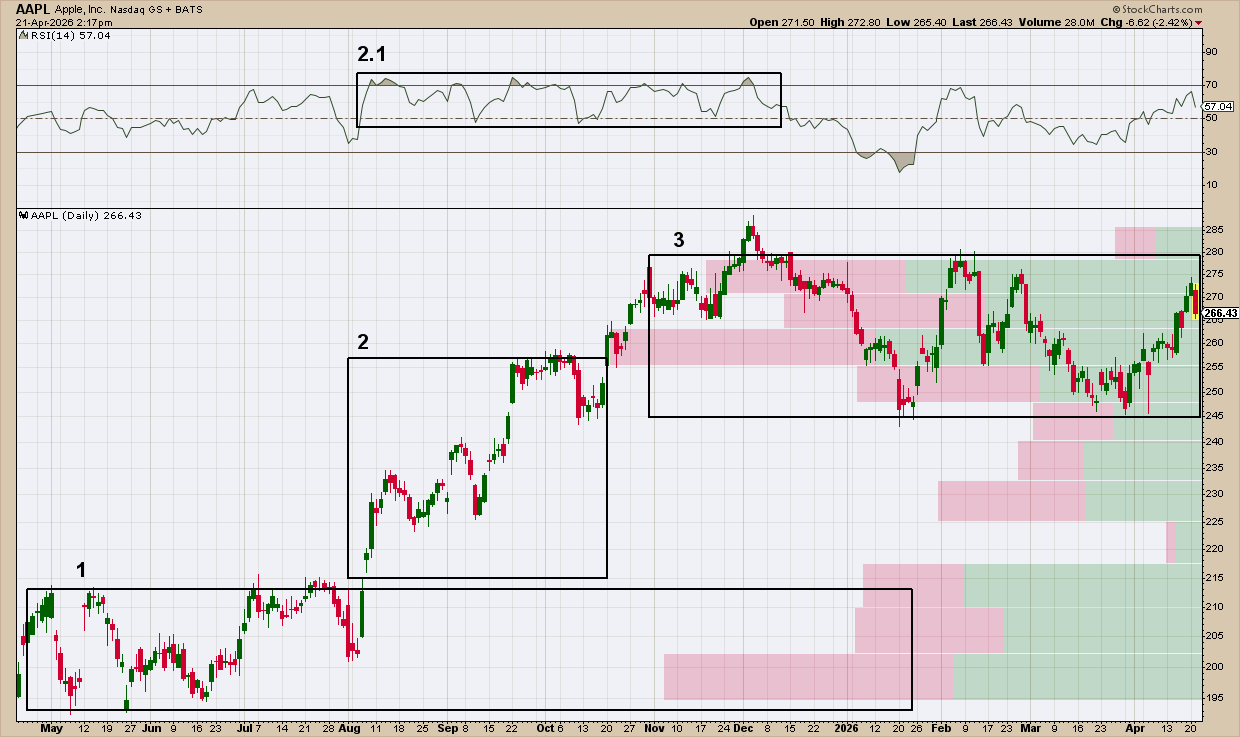
Take a look at this chart of Apple, Inc. (AAPL).
First, notice how price got mired in a back-and-forth range at 1 and 3, and how that corresponds to the HVNs shown on the right side of the chart. These are contested ranges in which buyers and sellers are actively positioning (by buying or selling) based on their perceived value levels.
Now, take a look at 2. This box wasn’t intended to capture the entire uptrend but only the segment in which prices are moving through LVNs. From the August breakout to mid-October resistance, you have a few fleeting jumps in price before getting stuck at 3.
So, if price falls back into that LVN territory, will it accelerate to the downside? There’s no guarantee, but given very little volume taking place in that area, it’s more likely to do so.
So, to simplify things:
- HVN often means traffic jam (but pressure can build for a breakout)
- LVN can mean open highway (price moves with less resistance)
The main point: Anticipate behavior and watch for when behavior changes.
Insider Tip #2: A Simple Breakout Filter
Not all breakouts are equal. While you can’t predict how price will fare after a breakout with any degree of certainty, you can at least anticipate scenarios in which price might continue or fall back. Volume-by-Price is one tool you can lean on for this.
Imagine two breakouts. The first is about to run into a thick HVN field. The other moves into a low-volume pocket of LVNs. As you might guess, the first trade is likely to stall, while the second is likely to continue with little resistance (assuming there’s no other form of resistance on the chart). Of course, there’s no guarantee, so you have to plan for both scenarios. But at least, you can see the likelihood of each.
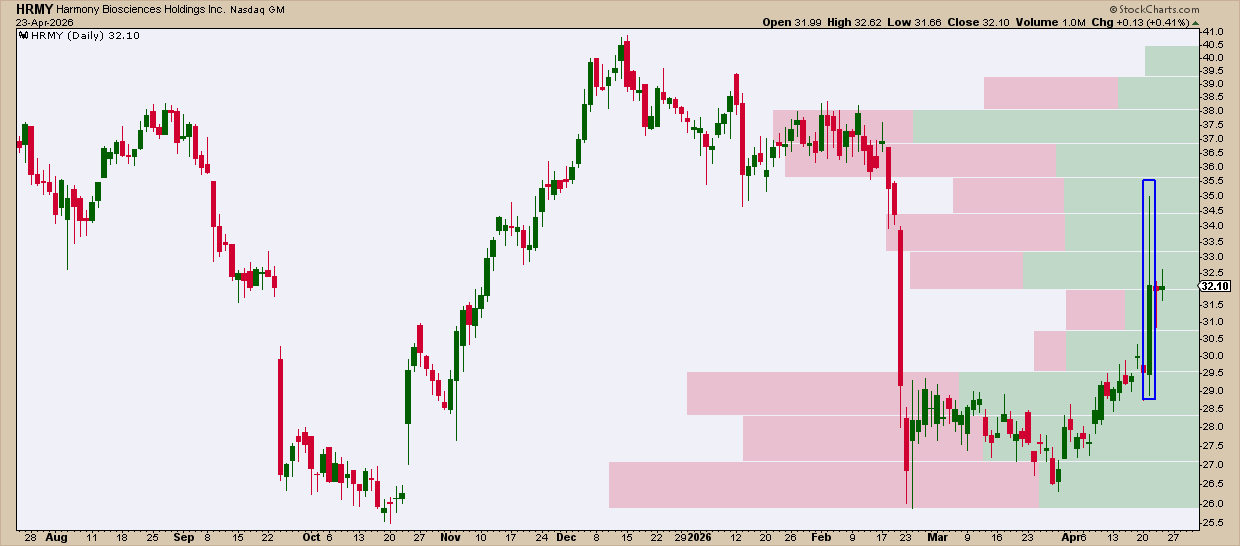
This is a daily chart of Harmony Biosciences Holdings Inc. (HRMY). Notice the strong price rejection in the blue rectangle. Technically, price was likely responding to resistance formed through the January consolidation range. But that consolidation also marked a cluster of thickening HVNs. In short, you might have anticipated the rejection if you were looking at the volume in addition to the price action.
So, before trading a breakout, plot Volume-by-Price and glance to the right of the chart. If there’s “air” above price, the move might have more space to run.
Insider Tip #3: Watch Whether Price Is Earning Acceptance
Volume-by-Price shows you where the market has accepted value, but it doesn’t quite show you acceptance in real time. That’s a limitation. So instead of trying to predict new HVNs, focus on how price behaves after leaving existing ones.
Here’s a simple way to read it:
- If price breaks above an HVN and clears a nearby swing high while holding those levels, it suggests value may be migrating higher.
- If price pushes above resistance but fails and falls back below that swing level into the prior HVN, the move lacks acceptance.
- If price breaks below a key swing low (support) and stays below it, watch for acceptance forming at the lower range.
- If price leaves an HVN but fails to hold above/below key levels, anticipate it rotating back toward prior value.
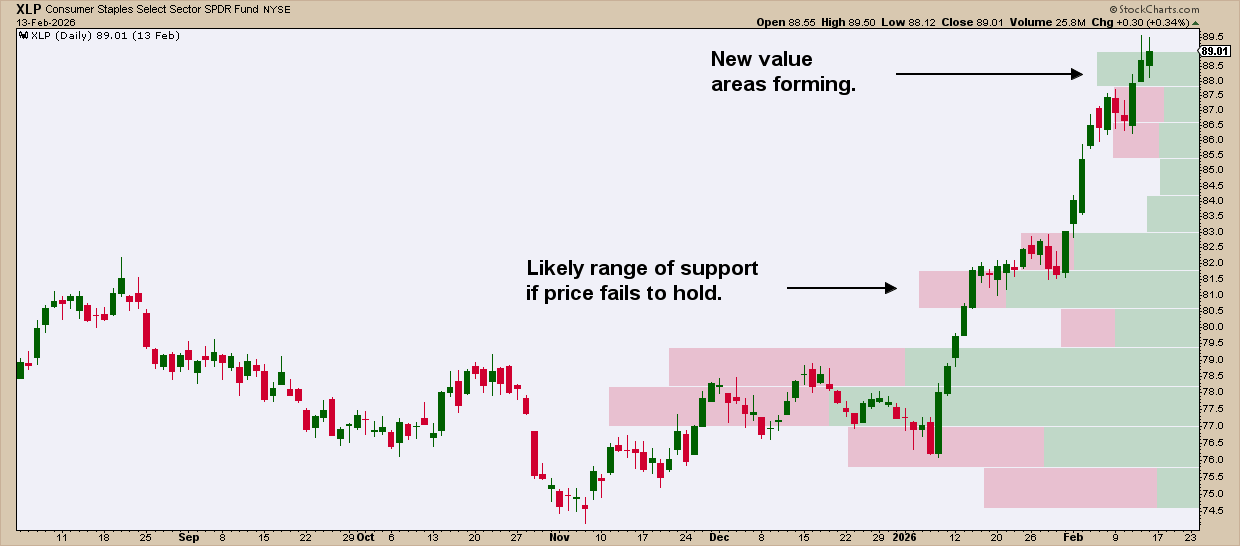
Consumer Staples Select Sector SPDR Fund (XLP) shows a new value area forming at the highs. But if it doesn’t hold, the next HVN, though smaller, might provide support.
Here’s what happened just a few weeks later.
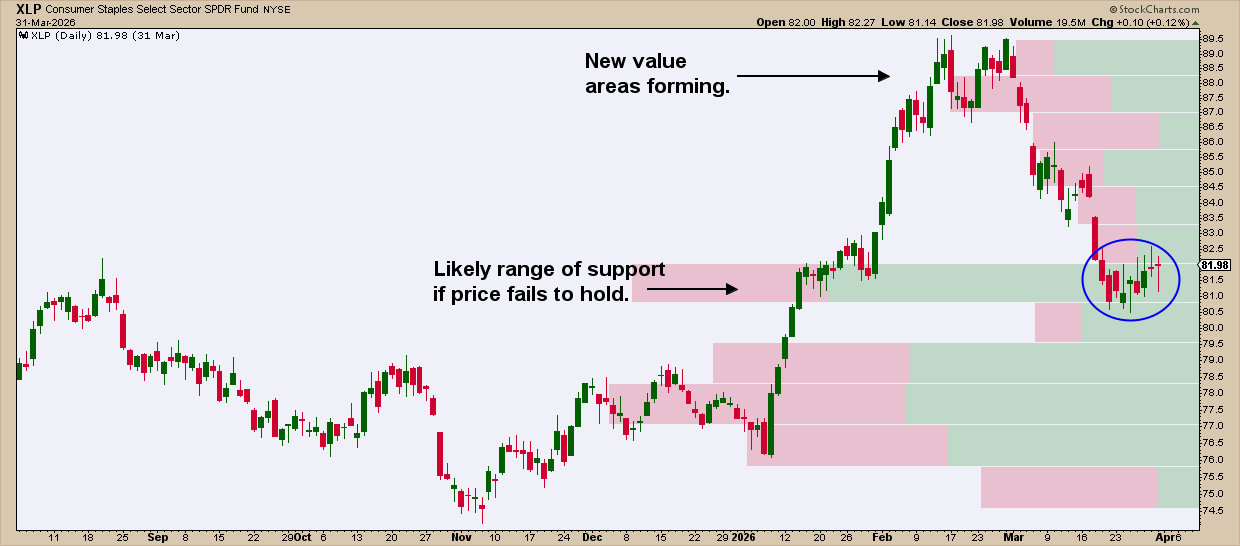
The main point is that, while watching new value areas forming, focus on price behavior in relation to previous value levels.
And That’s a Wrap
Using Volume-by-Price to plot support and resistance is a solid starting point, but it’s only scratching the surface. The real value comes from a nuanced understanding of how price behaves around those zones. HVNs show you where the market has agreed on value. LVNs show you where it hasn’t. That distinction helps you anticipate when price is likely to stall, rotate, or move with speed.
Just remember: Volume-by-Price isn’t a precision tool. It won’t give you the real-time auction detail of J. Peter Steidlmayer’s Volume Profile. But it doesn’t need to. Even from a distance, it reveals where the market has done plenty of business, and where it hasn’t.
The bottom line: If you can see where value is, and where it’s shifting, you’re already thinking one step ahead of everyone else.