The Stock Market Is at a Crossroads—Watch These Key Levels

Key Takeaways
- The major stock market indexes remain range-bound, with support and resistance levels defining the next potential move.
- Gold is showing early signs of strength, but it must clear key technical levels before the broader trend turns bullish.
- Earnings are the main focus now, though rising oil prices, Treasury yields, and the upcoming Fed meeting could take center stage.
The stock market is acting like it’s in a heavy traffic commute, as the major indexes continue to move up and down without moving in a clear direction.
The S&P 500 ($SPX) has settled into a repetitive pattern, grinding higher for a few sessions and then giving those gains back.
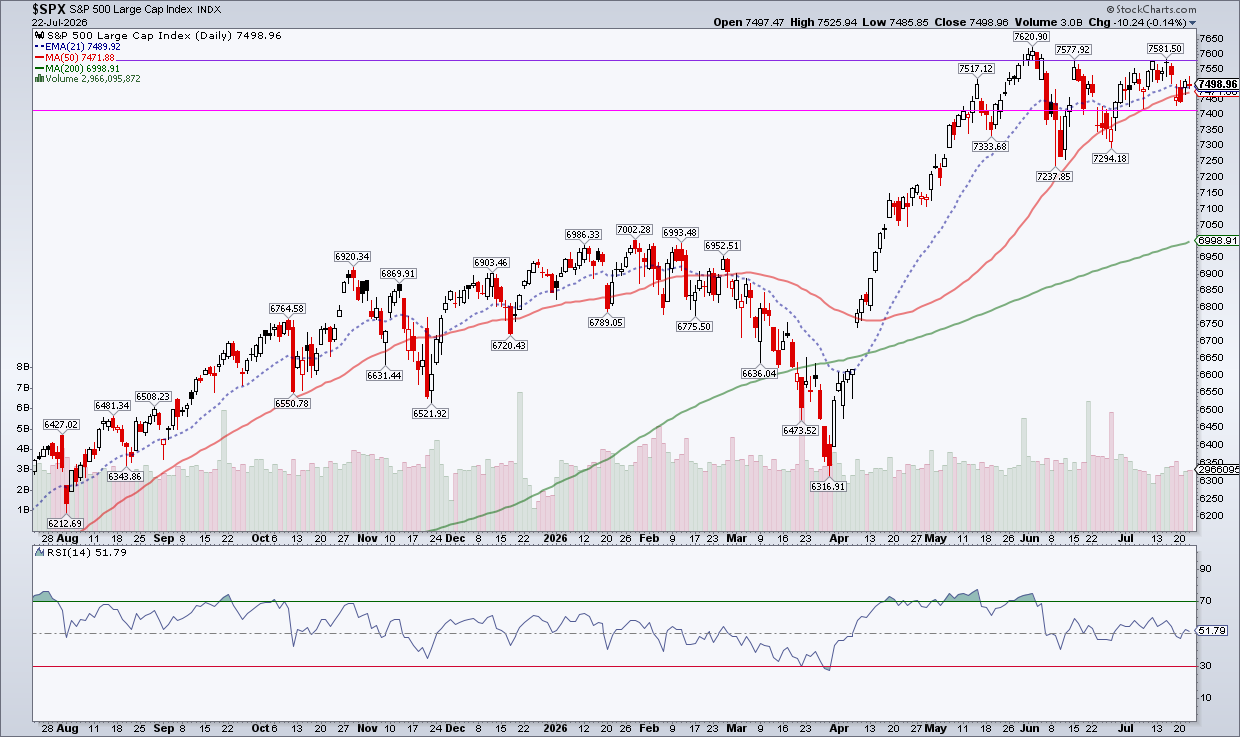
The solid pink and purple horizontal lines mark the first support and resistance levels I’m watching. These levels were derived from the weekly chart of the S&P 500. I have similar charts for the Nasdaq Composite ($COMPQ) and Dow Jones Industrials ($INDU) set up in my dashboard. They’re the first charts I review before the market opens because they give me a read of whether the market is leaning more bullish or bearish.
All three indexes are hovering near their 21-day exponential moving averages (EMAs). The question is whether earnings reports from Alphabet (GOOGL), Tesla (TSLA), IBM (IBM), and other heavyweights break the structure.
The stock market is at an interesting juncture. While the major indexes remain stuck in sideways ranges, gold is beginning to show signs of life, and oil prices are moving higher.
Gold Moves Higher
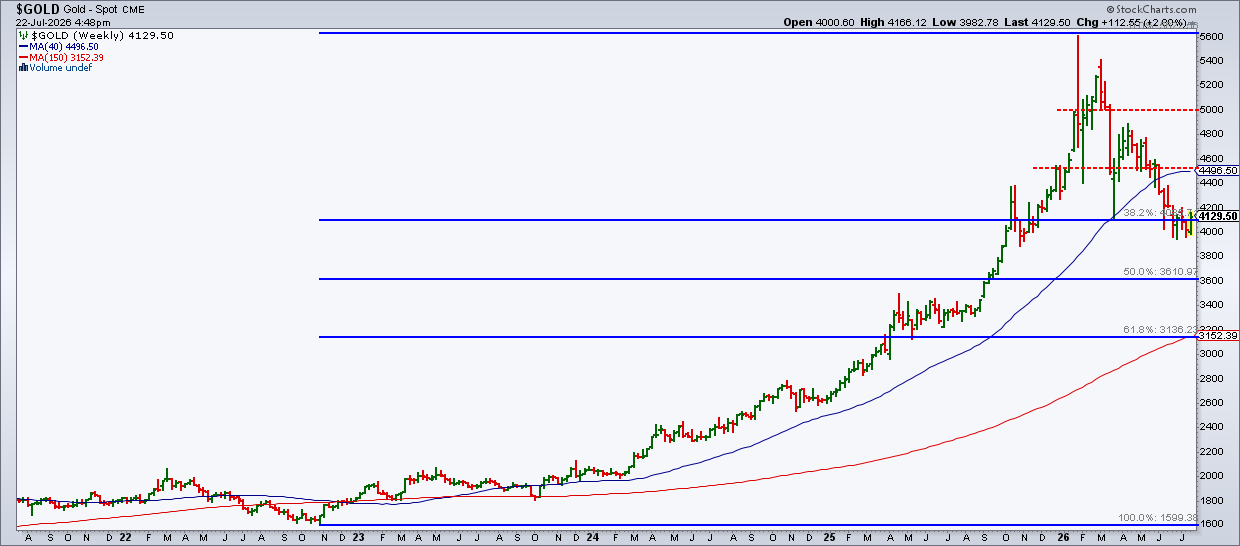
The five-year weekly chart of $GOLD below shows that the yellow metal has been trading around its 38.2% Fibonacci retracement level. Gold will need to break above this area and move toward $4,500 per ounce to confirm that a more meaningful upside move is in play.
Turning to the daily chart, gold is trading above its 21-day EMA, but it’ll need stronger follow-through to move prices higher. As the chart shows, gold also moved above this average in April and May, only to fall below it and resume its downtrend.
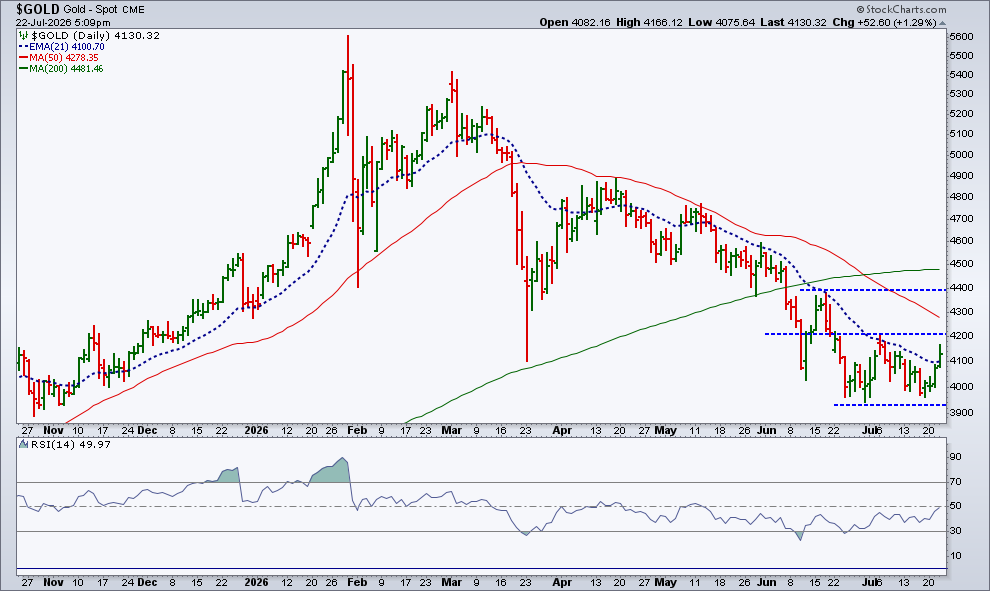
The broader trend remains lower but, if gold were to move above its 50-day simple moving average (SMA) accompanied by a Relative Strength Index (RSI) reading above 60, that would provide stronger evidence of improving momentum. This first hurdle would be a break above 4,200.
Gold still has work to do before the technical picture turns bullish, and much of the price action may depend on developments in the U.S./Iran conflict. As long as uncertainty remains elevated, investors may continue turning to safe-haven assets as a way to hedge portfolio risk.
Rising Yields Add Another Twist
What makes gold’s advance interesting is that U.S. Treasury yields are also rising. The 10-year U.S. Treasury Yield Index ($TNX) is at 4.66%, putting it close to its May 19 high. The rise in yields may be connected to the rebound in oil prices, with Light Crude ($WTIC) back near $86 per barrel.
The U.S. dollar is also strengthening, with US Dollar Index ($USD) trading above its 21-day EMA.
Gold generally doesn’t move higher when Treasury yields and the dollar rise. But higher oil prices can revive inflation concerns, which may renew demand for gold as a safe-haven and inflation hedge.
After-Hours Earnings Action
After Wednesday’s close, Texas Instruments (TXN), Alphabet, Tesla, ServiceNow (NOW), and IBM reported earnings. TSLA was the outlier after results fell short of expectations, sending the stock sharply lower in after-hours trading. Semiconductor stocks such as Micron (MU), Intel (INTC), and SanDisk (SNDK) got a slight lift in response to Wednesday’s earnings. If the strength continues into Thursday’s session, chip stocks could get a boost heading into the end of the trading week.
Earnings. Breakouts. Momentum. Find them faster.
The Bottom Line
There are plenty more mega-cap earnings on deck next week. For now, investors appear to be more focused on corporate earnings rather than rising oil prices, Treasury yields, and gold. But the focus could shift back to the broader macro picture when the Federal Reserve meets on July 29. By then, perhaps the market would have finally gotten itself out of its congestion and decided which direction it wants to move.
Disclaimer: This blog is for educational purposes only and should not be construed as financial advice. The ideas and strategies should never be used without first assessing your own personal and financial situation, or without consulting a financial professional.