Warning Signs for Mega-Caps? This ETF Chart Deserves Your Attention

Key Takeaways
- The most important stocks enter a pivotal period as earnings from Apple, Microsoft, Meta, Amazon, Alphabet, Tesla, and others pair with the July Fed meeting.
- Technical warning signs are emerging as MAGS & XLG drift from highs during what’s usually a bullish month.
- The market's calm may not last, with traders bracing for a surge in volatility that could set the tone for stocks leading up to the midterms.
The earnings season was expected to be a wild one, and that's what we've been getting so far.
John Butters at FactSet noted that, through last Friday, the average beat was modestly outperforming the S&P 500, but misses were getting creamed to the tune of –9%. Those returns cover the two days leading into an earnings event and the two sessions after. Kevin Gordon at Schwab then zoomed in on the single-day response, finding that misses were outperforming this season (data through Tuesday morning).
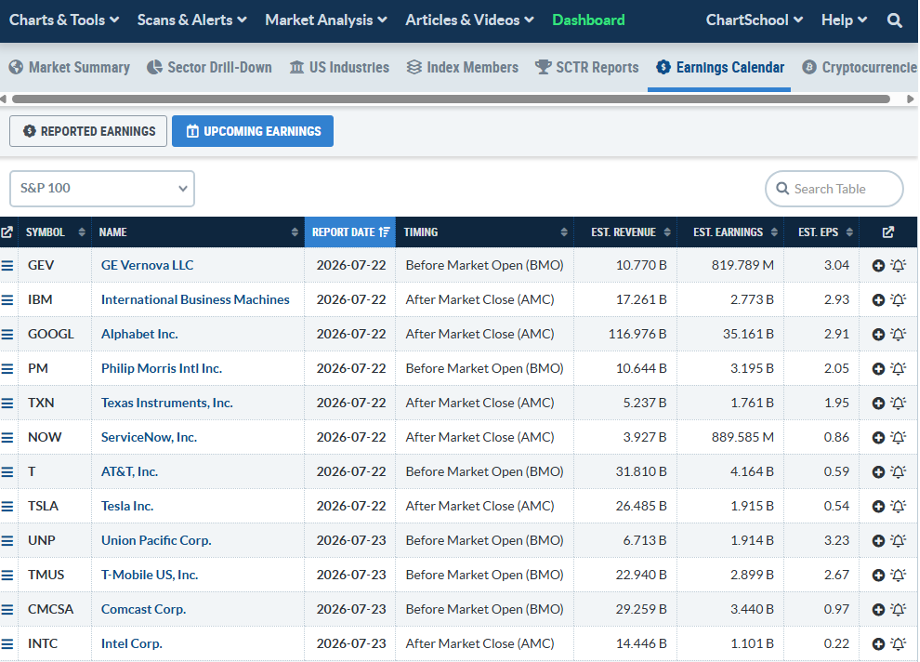
Looking ahead, Alphabet (GOOGL) and Tesla (TSLA) report Wednesday evening, along with that wild child known as IBM (IBM). Intel (INTC) puts out numbers Thursday. You can find all the earnings events on the StockCharts Earnings Calendar.
It's indeed a stock picker's market, given extremely low intra-market correlations, wide dispersion, and a pronounced gap between the teen Cboe Volatility Index (VIX) and the 50+ Cboe S&P 500 Constituent Volatility Index (VIXEQ).
The Main Event Is Still Ahead
But this week may be mere child’s play compared to the volatility-catalyst onslaught over July’s final week. And it’s not just a domestic story. SK Hynix (SYHY) and Samsung report results right before Mag 7 second-quarter figures hit the tape. Meta Platforms (META) and Microsoft (MSFT) lead off Wednesday after the bell, followed by Apple (AAPL) and Amazon (AMZN) Thursday AMC.
The fun doesn’t stop there. Several mega-cap tech and AI players present at the Future of Memory and Storage 2026 conference in Santa Clara, California, which runs from August 4 through 6.
Mega-Caps Shedding Momentum
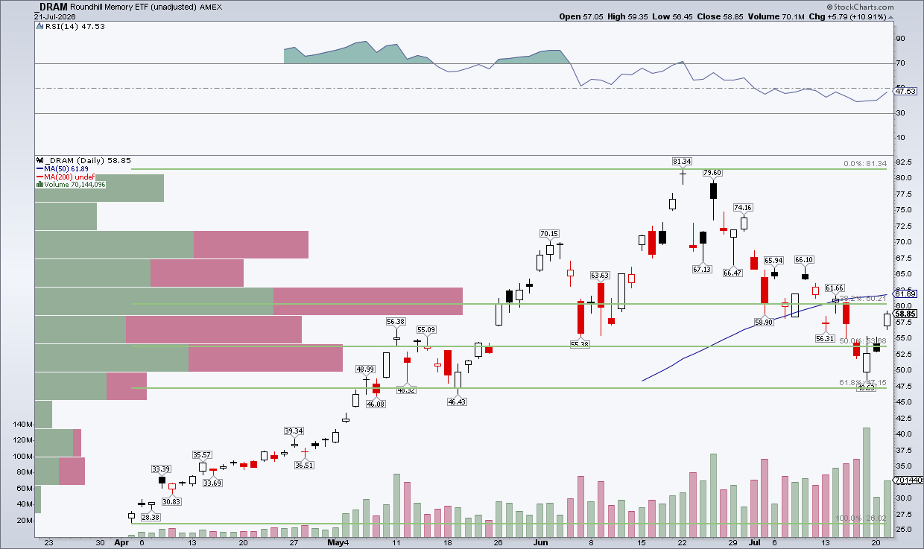
Big tech itself is wobbling into the heart of the reporting period, certainly not accelerating into it. The Roundhill Big Tech ETF (MAGS) is down a handful of percentage points from its May 14 peak and still below its high from last October. Of course, MAGS doesn’t hold this year’s massive S&P 500 memory-chip leaders. To catch a glimpse of the storage space, the Roundhill Memory ETF (DRAM) retraced 61.8% of its April (inception)-to-June rally, falling from $81 to $49 before rising for three straight sessions through Tuesday.
Here’s an ETF that captures all mega-cap ups and downs. The Invesco S&P 500 Top 50 ETF (XLG) has everything from semiconductors to consumer tech to software and AI. Owning the 50 largest U.S. equities, it goes beyond the Mag 7, with a dash of other, more cyclical mega-caps. More focused than the SPX but broader than MAGS, its chart is not a whole lot different from the glamour stocks.
This Chart Sends a Cautionary Message
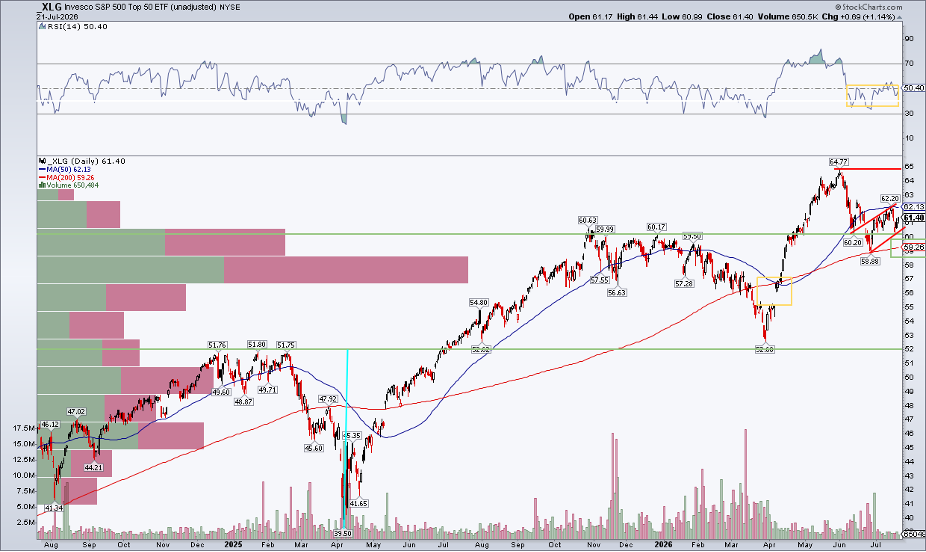
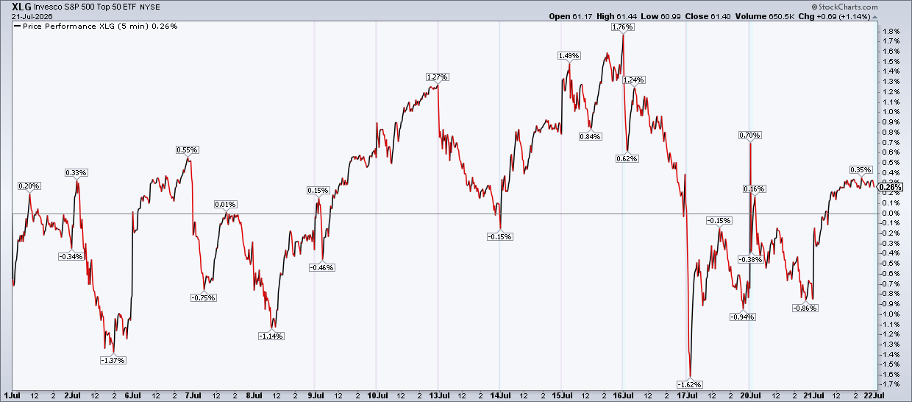
Notice in the chart below that the ETF remains below its June 1 all-time high, peaking after the mid-May record. Indeed, the summer has not been strong for the mega-caps, and XLG now trades below its now-falling short-term 50-day moving average. But the fund met buyers on a dip to the 200-DMA right before the end of the first half. More recently, the July range is tight, which is not surprising, given that the S&P 500 has gyrated just 2.1% so far in the third quarter... traders appear to be bracing themselves for real volatility that could begin next week.
Also, look at the RSI momentum oscillator at the top of the SharpChart. It printed a modestly lower high at the June 1 peak, and it has since drifted into a neutral zone from 35 to 55. I’d like to see XLG reassert leadership, with price jumping above the 50-DMA and the RSI hitting, say, 70. That would be ideal price-and-momentum confirmation.
An XLG Bear Flag?
The bears may have their say, however. A gap lingers near $55, which could absolutely get filled if we see a garden-variety midterm election-year correction over the August-through-October stretch.
To me, July’s low-volatility consolidation following the June swoon is ominous. The trend of larger degree appears to be down, given this possible bear flag pattern. If it breaks, $55 on XLG is in play, while major support is near $52 (the late-2024/early-2025 high and where the ETF was scooped up this past March).
The technical story doesn’t end there. A measured-move upside price objective to $64 was triggered upon a breakout above $52 about a year ago, based on the November 2024-to-April 2025 decline ($12) and the subsequent breakout above $52 last summer. XLG tagged $64 and change at the aforementioned June zenith.
Seasonality Isn't Helping
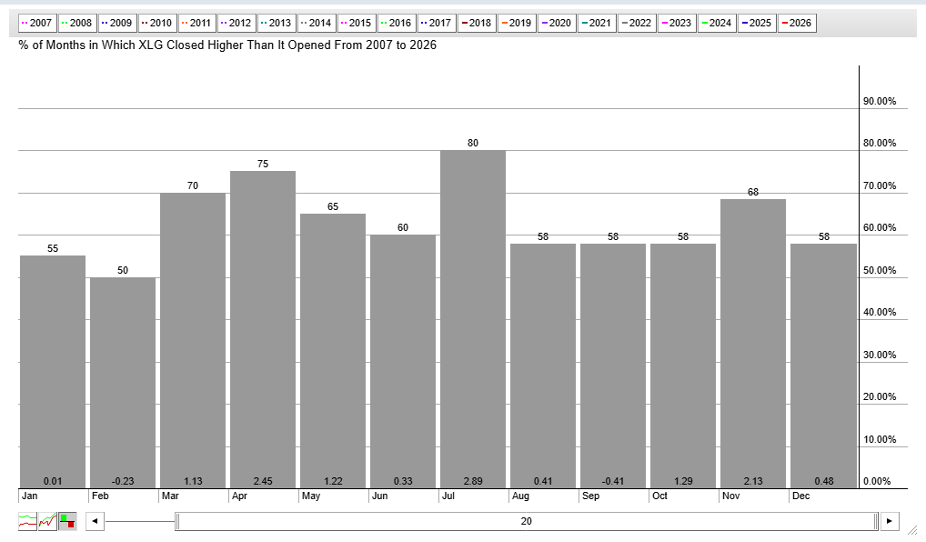
Double-clicking on seasonality, XLG is not doing what it’s supposed to. The fund is flat in July during what has typically been the most bullish month. The “S&P 50” has returned 2.9%, on average, in July since 2007, and has been up in 16 of 20 instances.
A weak response to mega-cap tech-related earnings this week would be inauspicious price action leading into a notoriously bearish calendar stretch.
The Bottom Line
U.S. mega-caps aren’t having their best summer. Yes, AAPL has notched records, but it’s arguably the most defensive of the Mag 7 these days. NVIDIA (NVDA) is stuck well beneath its May 14 all-time high of $236; GOOGL’s is likewise two months removed from its latest glory days; AMZN has been a chop-fest, sans a single six-week thrust off the March 31 low.
The next handful of sessions will be the ultimate test: earnings reports, a Fed meeting, and traders gearing up for the often-treacherous period ahead of the election.
Disclaimer: This blog is for educational purposes only and should not be construed as financial advice. The ideas and strategies should never be used without first assessing your own personal and financial situation, or without consulting a financial professional.