StockCharts Insider: What Every Trader Should Know About Extended Hours, Intraday Charts, and Technical Indicators
Before We Dive In…
Indicators are designed to help you perceive certain market dynamics more clearly. But first they have to consume data: Price. Volume. These are key ingredients. Extended hours trading changes the recipe. Volume vanishes. Thin trading distorts calculations. Momentum gets magnified. Trends look different.
The math is still running. But what it’s running on—that’s a different conversation. And if you’re looking at an intraday chart, the market presents another landscape altogether.
How do you think this impacts indicators? And what happens the moment that bell rings and millions of traders flood in?
You’re Adding Bars, but You’re Also Changing the Environment
One checkbox unlocks this function. In SharpCharts, it's in the Chart Attributes section. In StockChartsACP, it's in the Chart Settings panel.
Check the Extended Hours box and your intraday chart expands. Purplish shade for after-hours, greenish shade for pre-market. (Note: if you change the chart’s color scheme, it may change the after-hours and pre-market shade colors.)
Now you have more data. But it’s not quite the same. The inputs change. Liquidity thins. The cast of characters driving price shrinks considerably. And your indicators get somewhat skewed.
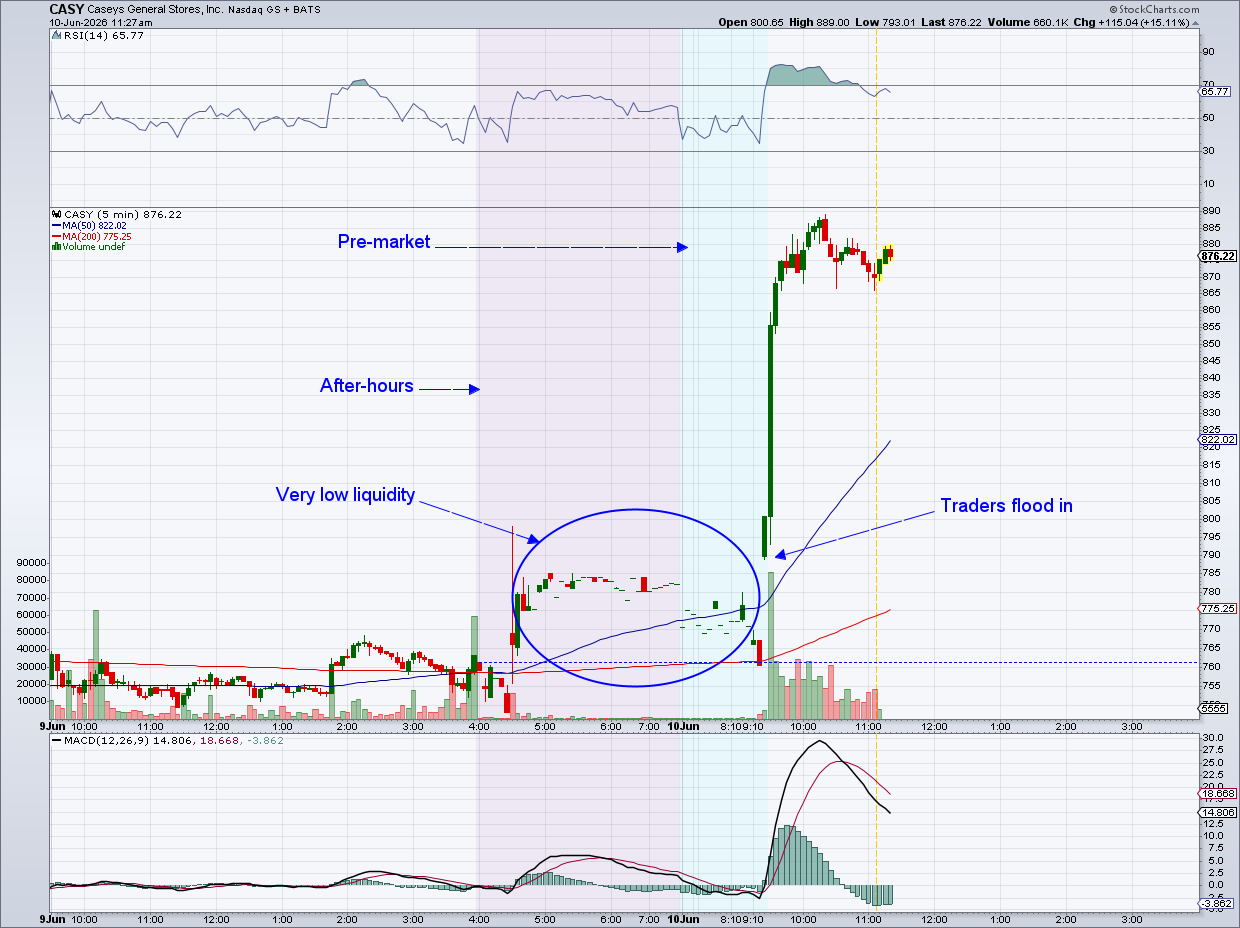
Breakouts from congestion can be significant. But does that apply during extended hours trading? Consider what's actually happening. Institutional investors finalizing positions. Liquidity dwindling as retail investors are nowhere to be found. In this environment, a handful of well-capitalized players can move price more easily. That accounts for the volatility spikes you'll occasionally see between the opening and closing bell.
The Relative Strength Index (RSI) and Moving Average Convergence/Divergence (MACD) typically react to a wide market. Millions of participants, competing interests, real conviction. But after hours? They could be reacting to three fund managers and a news algorithm.
Reliable or not depends on how you trade. But you can't say that an RSI or MACD reading driven by millions of regular-session participants is of the same nature as one generated in the quiet hours before or after the bell.
What We Know for Certain
Some of the above is debatable. Not everything’s certain. But here’s what we know is true.
- Volume data simply doesn't exist for extended hours bars. Anything volume-based like VWAP, OBV, CMF is impaired during those sessions.
- Extended hours markets are genuinely less liquid. Thin trading produces volatile price bars. And the volatility is much less predictable.
- Indicators are mathematically fed by price closes. If those closes come from thinly-traded bars, the math is working on noisy data. This means the indicator consumes more market noise as its input. And the output is only as reliable as its input.
So, the key issue here is the absence of reliable volume data. Take a look at the Robinhood Markets Inc. (HOOD) chart below.
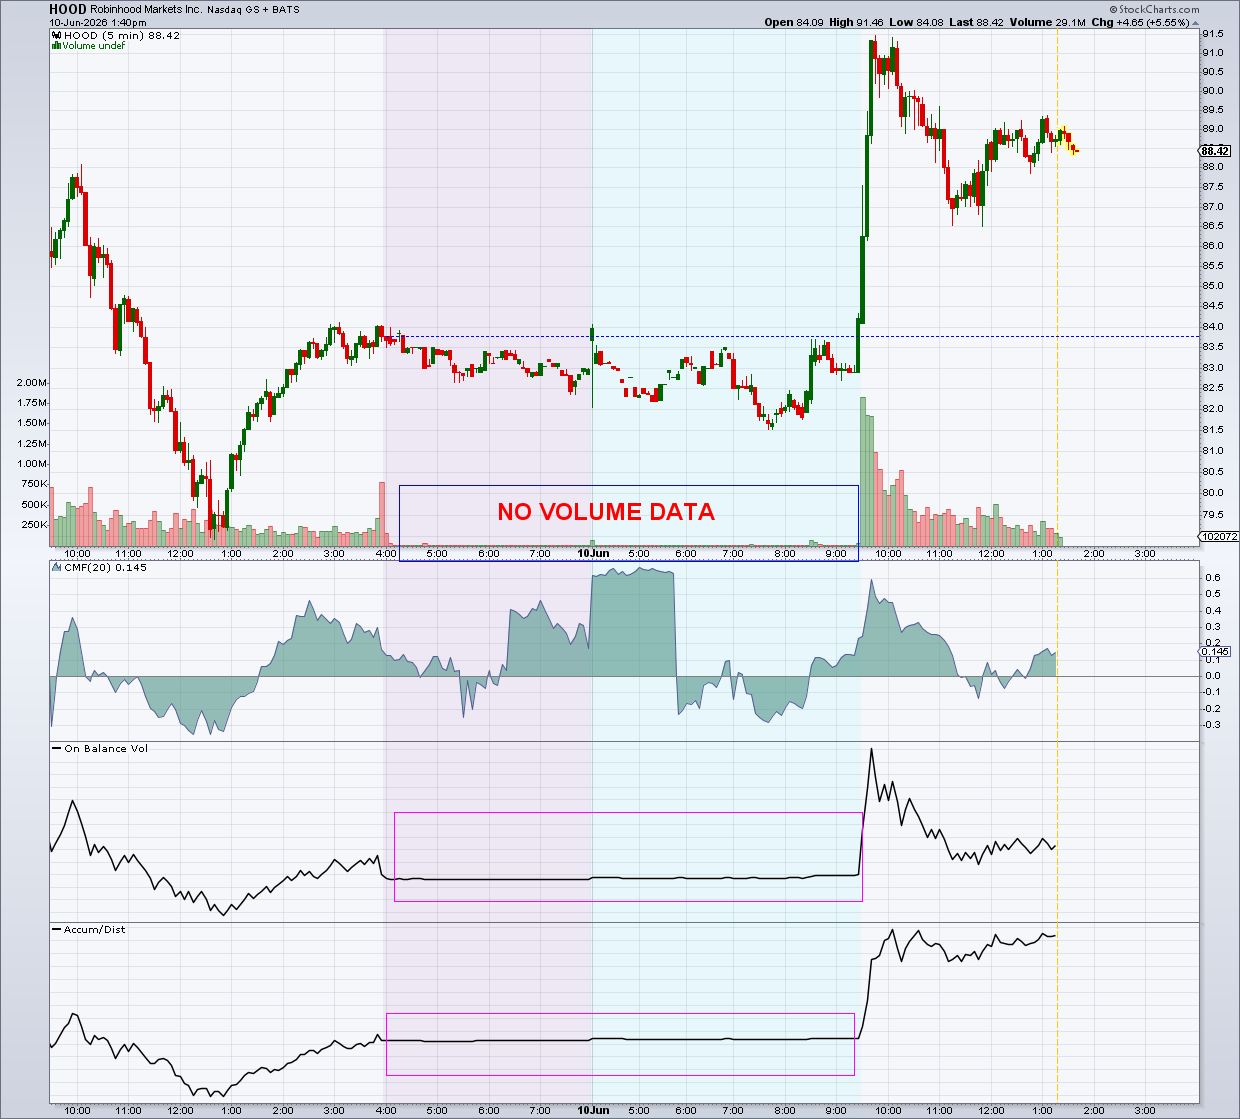
The HOOD chart shows no volume data. Money flow indicators like the Chaikin Money Flow (CMF), On Balance Volume (OBV), and Accumulation/Distribution Line (ADL) need volume as an input. OBV and ADL are frozen. No input.
What about the CMF? It appears to be working. But how reliable is it, really? These indicators are more directly affected by the absence of volume, while other indicators are more indirectly affected.
Just for comparison’s sake, here’s the same chart but without the extended hours.
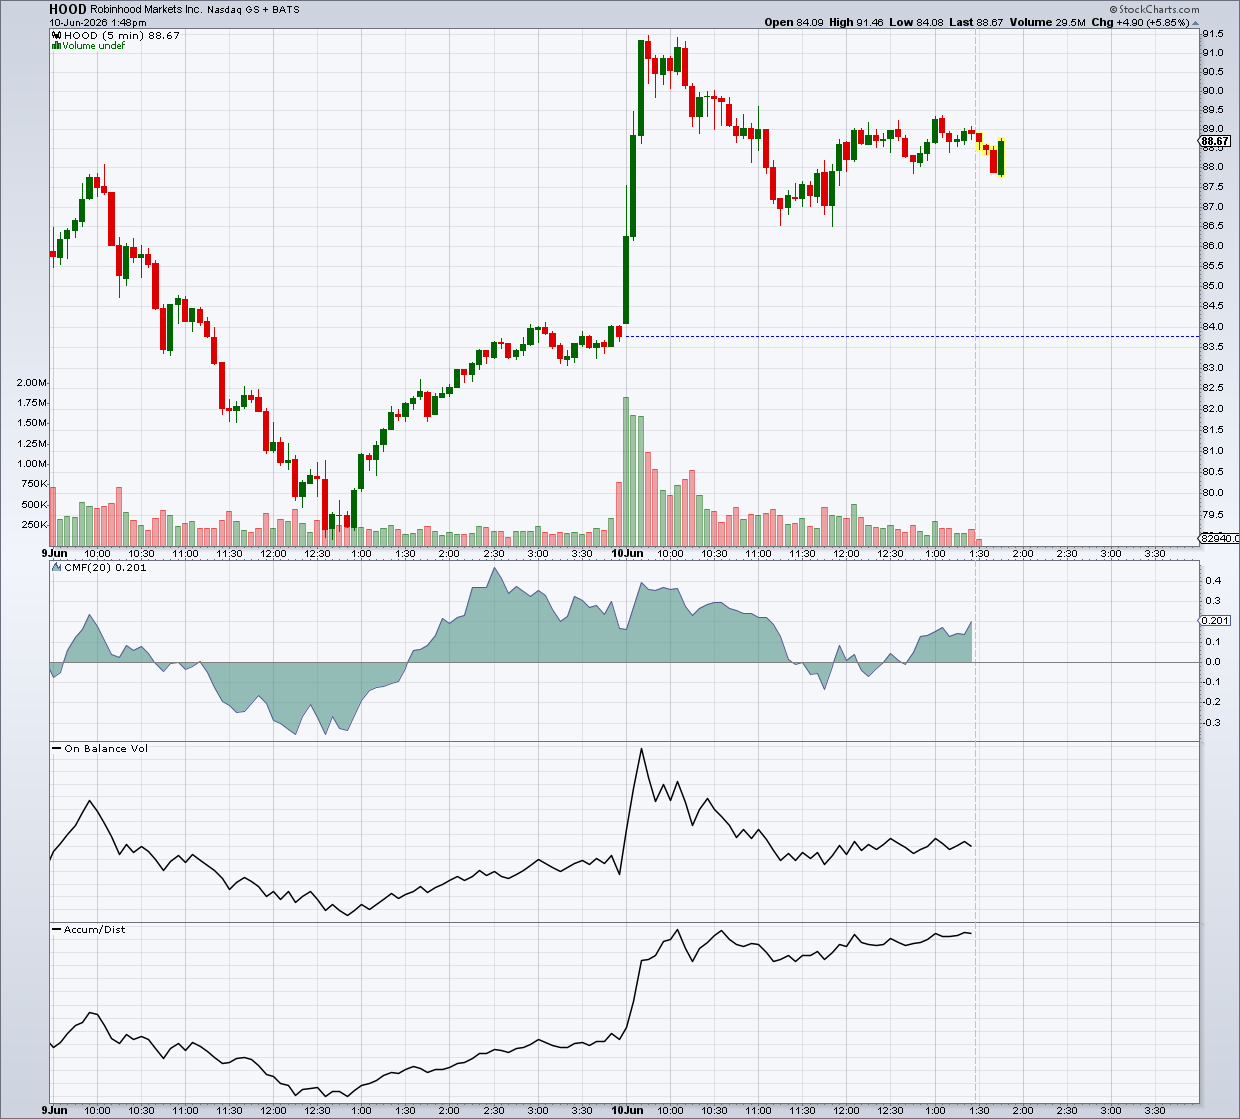
It’s cleaner. Smoother. Less noise. These indicators are still being applied to intraday data, not their original habitat. But the difference is visible. Whether it would have changed your read depends on the stock, the session, and what you were looking for.
Were These Indicators Even Built for Intraday Charts?
Every trader has their own preferred stack. But we can safely say that the RSI, MACD, and the Stochastic Oscillator are among them. Traders retrofit these to work intraday. The math still works. But they weren’t necessarily designed for smaller timeframes.
Experienced intraday traders know this. They know the extended hours period can be a different world entirely. So, if you’re looking to use this period in your analysis, you should get acquainted with the differences. Understand how they impact indicators not necessarily designed for such conditions.
Insider Tip: Know Your Tools. Know Their Limits.
Here's a quick reference. It won't cover every scenario. But it covers a few key indicators that matter.
So, if many of these are unreliable, what should you look at?
Plain Support and Resistance Might Hold Up Better During Extended Hours
Thin trading will distort all activity before and after regular market hours. No way around that. What’s less affected and slightly more reliable is plain support and resistance.
Support and resistance is pure price structure. No complicated formulas. No lookback inputs. No averaging, weighting, or smoothing. You’re simply identifying where price reversed, stalled, or consolidated.
Take a look at this Apple, Inc. (AAPL) chart.
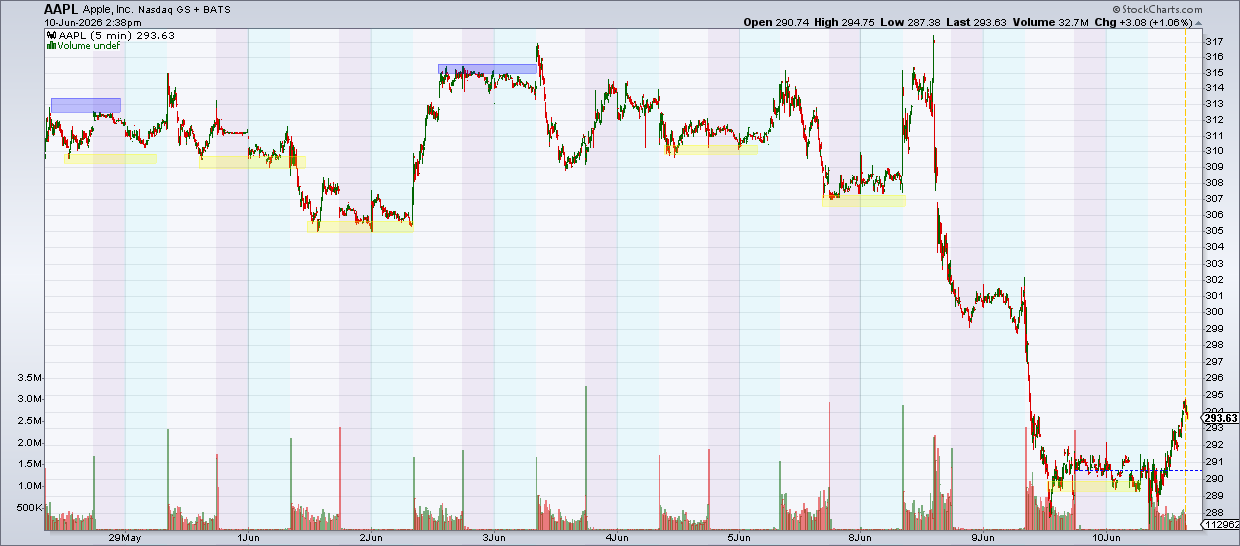
The yellow-shaded areas show extended hours price respecting support established during the regular session. When it holds, traders respond. When it breaks, they respond to that too. The blue-shaded areas show extended hours price responding to resistance established in the regular sessions. It’s at least one thing you can count on. But still, watch out for the illiquid trading environment. A handful of traders with loads of capital can move the price and cloud the picture entirely. That’s not a reliable signal.
And That’s a Wrap
Extended hours trading is a legitimate window into market activity. But the nature of that market activity is not the same when everyone is trading. It's thinner. Quieter. More easily distorted. The math keeps running. But the inputs are from a narrower market. So tread carefully, because when that bell rings and the full weight of the market floods in, things can change drastically.