Stop Thinking of RSI as "Overbought" and "Oversold"

The Relative Strength Index (RSI) is one of the most widely used momentum indicators in technical analysis, but it's also one of the most misunderstood.
If you ask most investors how they use RSI, they'll tell you that readings above 70 indicate an overbought market while readings below 30 signal an oversold condition. There's certainly some truth to that interpretation, but I believe it misses the indicator's greatest strength. Instead of focusing on individual overbought or oversold readings, I prefer to study the range of RSI. Where the indicator tends to spend most of its time often tells us far more about the underlying trend than any single signal.
Looking Beyond Mean Reversion
RSI, developed by J. Welles Wilder, compares the magnitude of recent gains with recent losses over a specified period, with the standard setting of 14 periods remaining the default on most charting platforms. Short-term traders often reduce that setting to make the indicator more responsive, allowing RSI to identify shorter swings within an established trend.
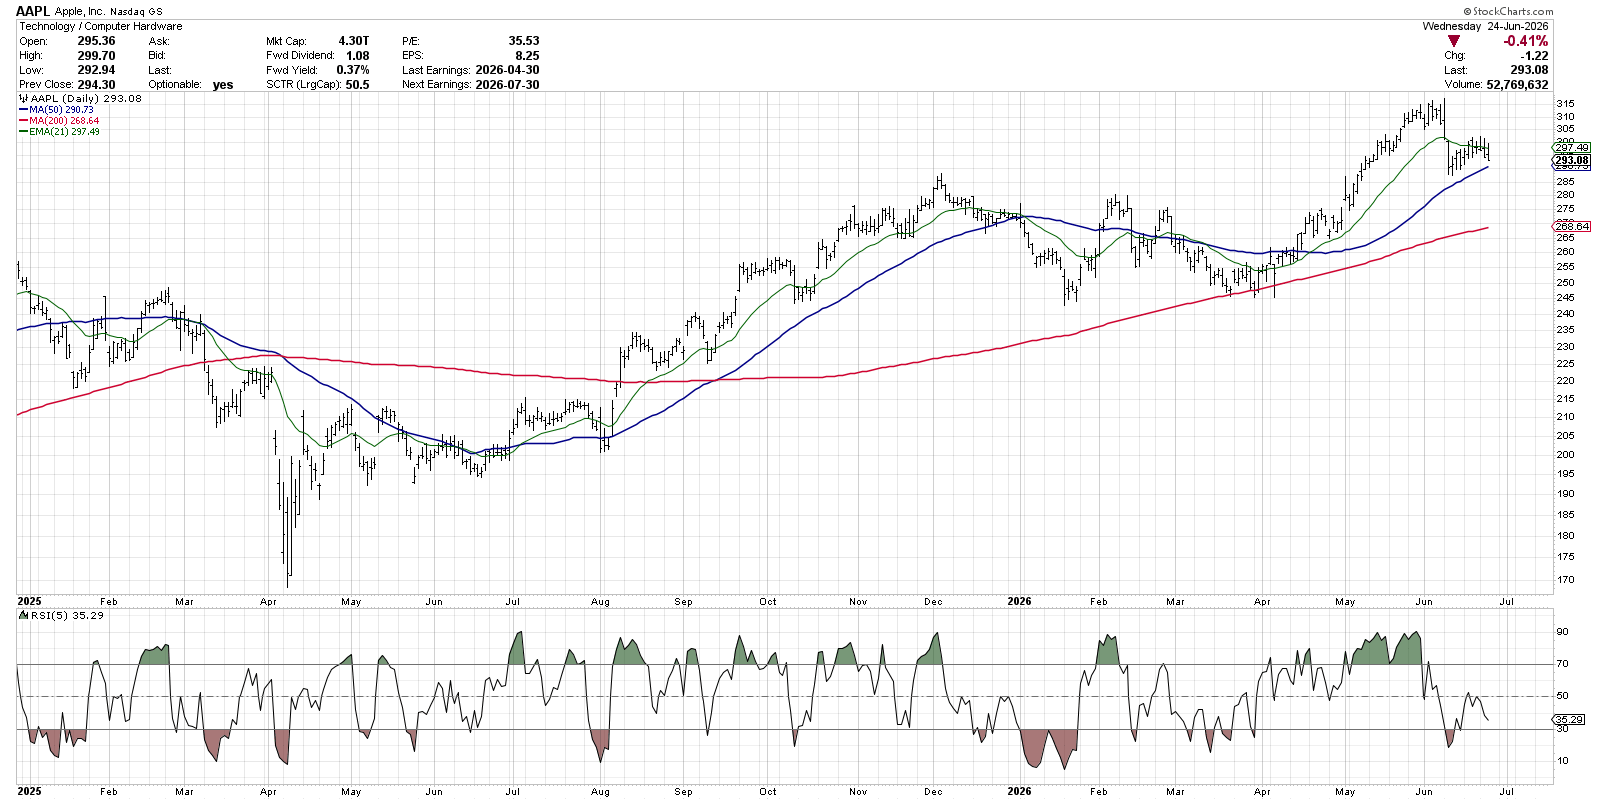
On a chart like Apple (AAPL), a five-period RSI frequently reaches overbought and oversold levels as the stock moves through a healthy advance. We can identify most short-term reversals in the second half of 2025 simply by waiting for overbought and oversold conditions. But while those signals can be helpful for swing traders looking to improve entry and exit timing, they don't necessarily tell us much about the bigger picture. For that, I find the traditional 14-period RSI to be much more informative.
The Range of RSI Reveals the Trend
One of the concepts that fundamentally changed the way I use RSI came from Connie Brown's Technical Analysis for the Trading Professional, a book which holds a place of honor on our Market Misbehavior Recommended Reading List. Instead of asking whether RSI has become overbought or oversold, Brown encourages investors to observe how the entire range of the indicator changes as trends develop.
During a healthy uptrend, RSI typically reaches overbought territory on rallies but rarely falls below 40 during pullbacks. The entire momentum profile shifts higher, reflecting persistent buying pressure. The opposite tends to occur during downtrends, with RSI often struggling to move above 60 on rallies while regularly reaching oversold levels as sellers remain in control. Thus, instead of oscillating around the midpoint, the indicator spends most of its time in the lower half of its range.
Sideways markets create a different signature altogether. As buyers and sellers reach equilibrium, RSI often fluctuates between roughly 40 and 60, reflecting a market that is consolidating rather than trending.
Apple Provides a Great Example
The accompanying Apple chart illustrates these different momentum regimes. During the stock's correction earlier in 2025, price established a series of lower highs and lower lows while RSI consistently remained in a bearish range. Momentum confirmed that sellers remained in control during this distribution period.
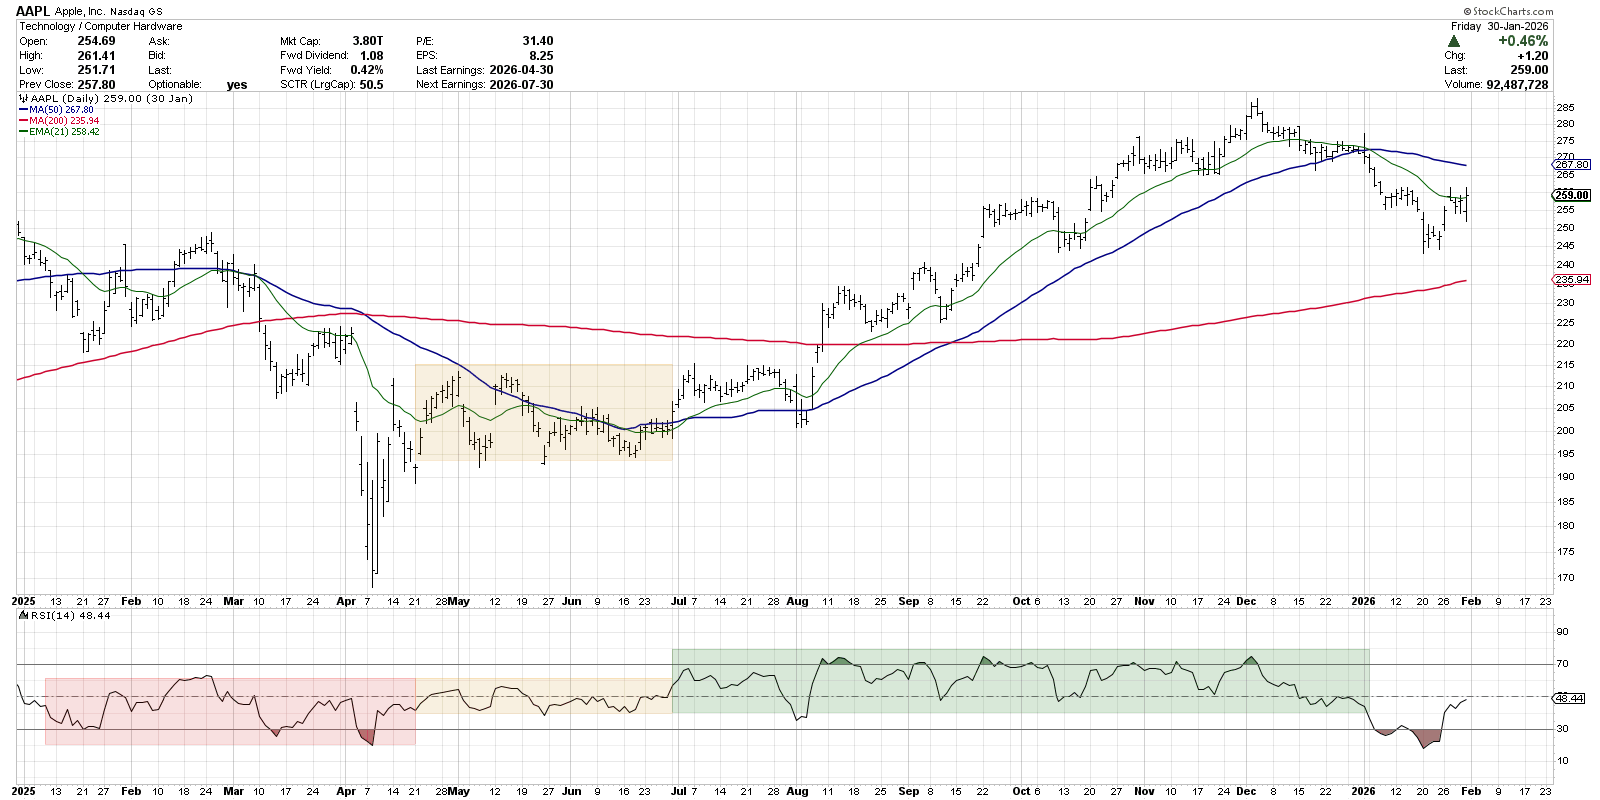
Then after a major low in April 2025, the price entered a consolidation phase, formed by a stable pattern of highs and lows. The RSI remained in a neutral position during this period, basically rotating between 40 and 60.
As Apple transitioned into a new advance in July, the behavior of RSI changed noticeably. Price began making higher highs and higher lows, moving averages turned higher, and RSI shifted into a bullish range. Pullbacks consistently held above the 40 level while rallies frequently became overbought. That change in momentum confirmed that the stock had moved from a consolidation phase into a new accumulation phase.
This framework also provides a simple way to monitor existing positions. As long as price continues making higher highs and higher lows and RSI remains above 40, temporary weakness should generally be viewed as a normal correction within an ongoing uptrend. A sustained break below 40, however, deserves attention because it often signals that the character of the trend is beginning to change.
Applying the Same Framework to the S&P 500
The same principles work just as well on broad market indexes.
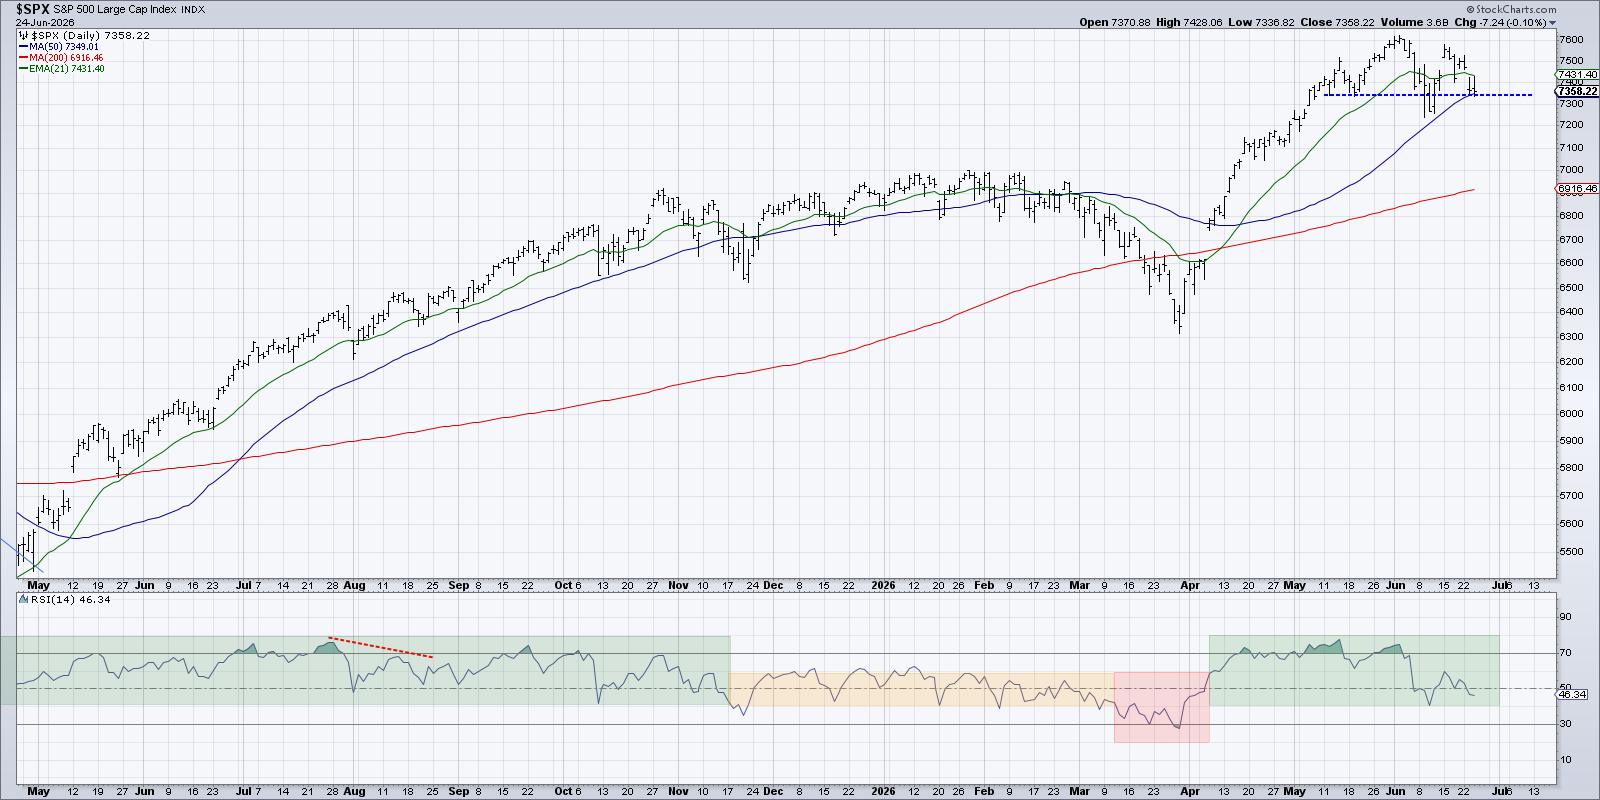
During the second half of 2025, the S&P 500 remained in a strong accumulation phase, with RSI consistently occupying a bullish range. Toward the end of the year, momentum became more neutral as RSI settled between 40 and 60 while price moved sideways, signaling that the market had entered into a period of consolidation.
A key bearish signal occurred when price broke below support and RSI simultaneously fell beneath 40. That combination confirmed that sellers had taken control and that the market had entered a distribution phase. Following the April lows, momentum improved dramatically as RSI climbed back above 60 and established a new bullish range.
Today, the market finds itself at another interesting point. Price remains above important support levels, but RSI has begun rotating back toward 40. Whether momentum stabilizes in a neutral range or breaks decisively lower will likely tell us a great deal about the next phase of the market.
Final Thoughts
Most investors think of RSI as an overbought and oversold indicator. While those signals certainly have value, I believe the indicator becomes much more powerful when viewed through the lens of trend analysis.
By focusing on the range of RSI rather than isolated readings, investors can quickly distinguish between accumulation, consolidation, and distribution phases. Combined with price structure and moving averages, this simple framework provides a more complete picture of market character and can help investors recognize when an established trend is strengthening or beginning to weaken.
The next time you pull up a chart of a stock or ETF, don't just ask whether the indicator has reached 70 or 30. Instead, ask the more important question: “Where has the RSI been spending most of its time?” The answer may tell you more about the trend than any individual momentum signal.
RR#6,
Dave
P.S. Ready to upgrade your investment process? Check out my free behavioral investing course!
David Keller, CMT
President and Chief Strategist
Sierra Alpha Research LLC
marketmisbehavior.com
https://www.youtube.com/c/MarketMisbehavior
Disclaimer: This blog is for educational purposes only and should not be construed as financial advice. The ideas and strategies should never be used without first assessing your own personal and financial situation, or without consulting a financial professional.
The author does not have a position in mentioned securities at the time of publication. Any opinions expressed herein are solely those of the author and do not in any way represent the views or opinions of any other person or entity.