The Simple Stock Scan That Helps Me Find New Market Leaders

As an equity investor, focusing on new leadership themes is absolutely crucial to navigating a changing market environment. Unless you have a consistent process of identifying the “next big thing”, you run the risk of holding yesterday’s leaders while a new theme captures investors’ attention.
I often track the new 52-week highs and lows as a measure of market breadth. Charts like this one have helped me recognize the weakness “under the hood” of the major averages in September, as new lows far outnumbered new highs.
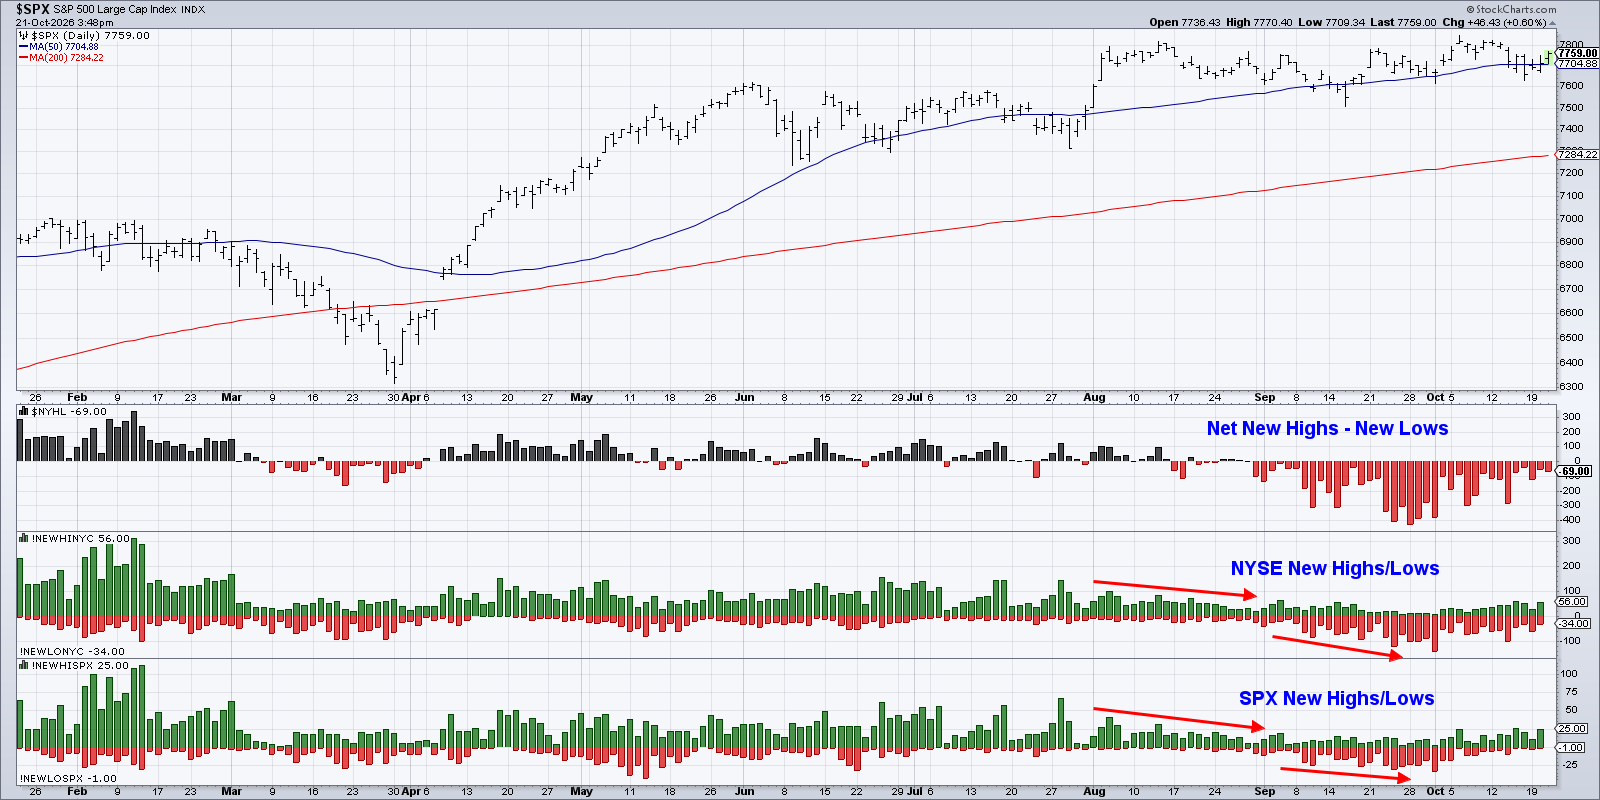
Years ago, I found that while new 52-week highs were a good measure of broad market strength, new three-month highs provided a much more actionable list of stocks to review. By regularly reviewing this list of three-month breakouts, I became much more effective at staying on top of new moves in the equity space. And tools like the StockCharts Screener and Scheduled Scans make this process easy to incorporate into your normal daily and weekly routines.
Today, I’ll share how I run my own scanning process, review some of the names appearing on the new highs list this week, and discuss broader market implications from these emerging leaders.
New Three-Month Highs Often Represent New Leadership
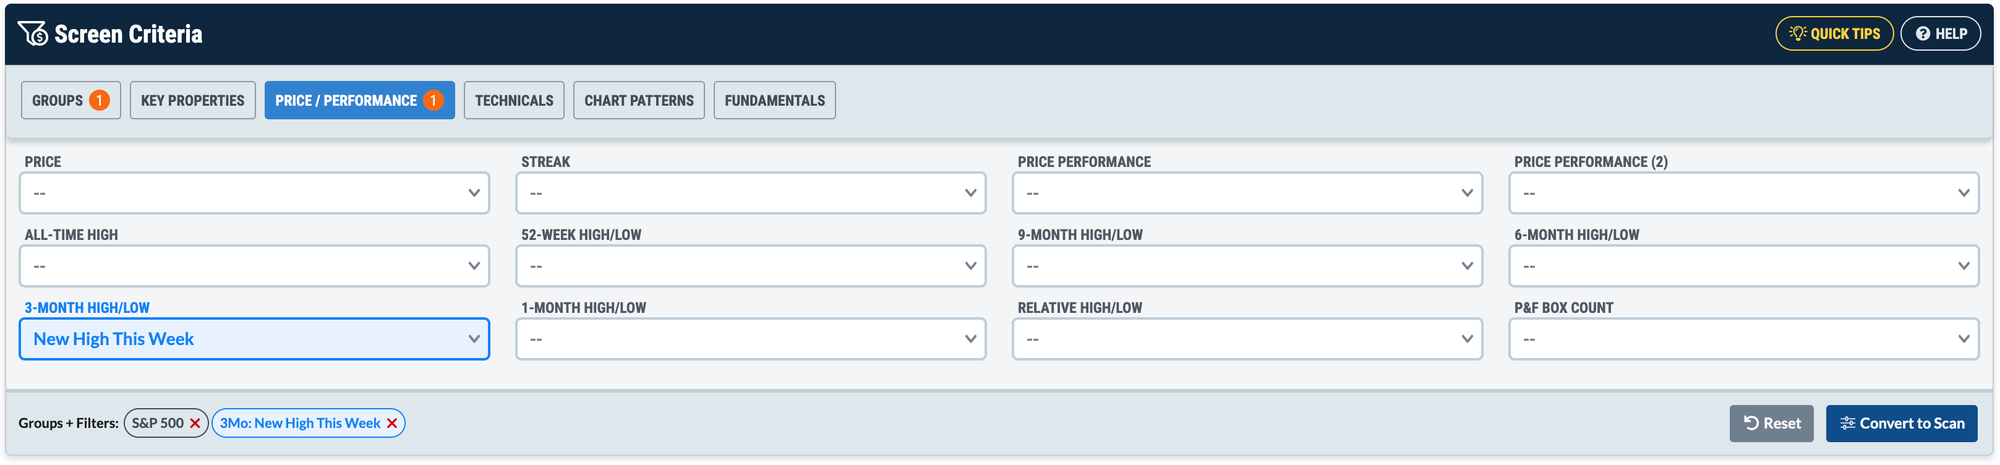
Running a quick scan for S&P 500 members achieving a three-month high this week generates a list of 35 stocks in a position of strength. You can replicate this approach by using the “3-Month High/Low” dropdown within the Price/Performance section of the StockCharts Screener.
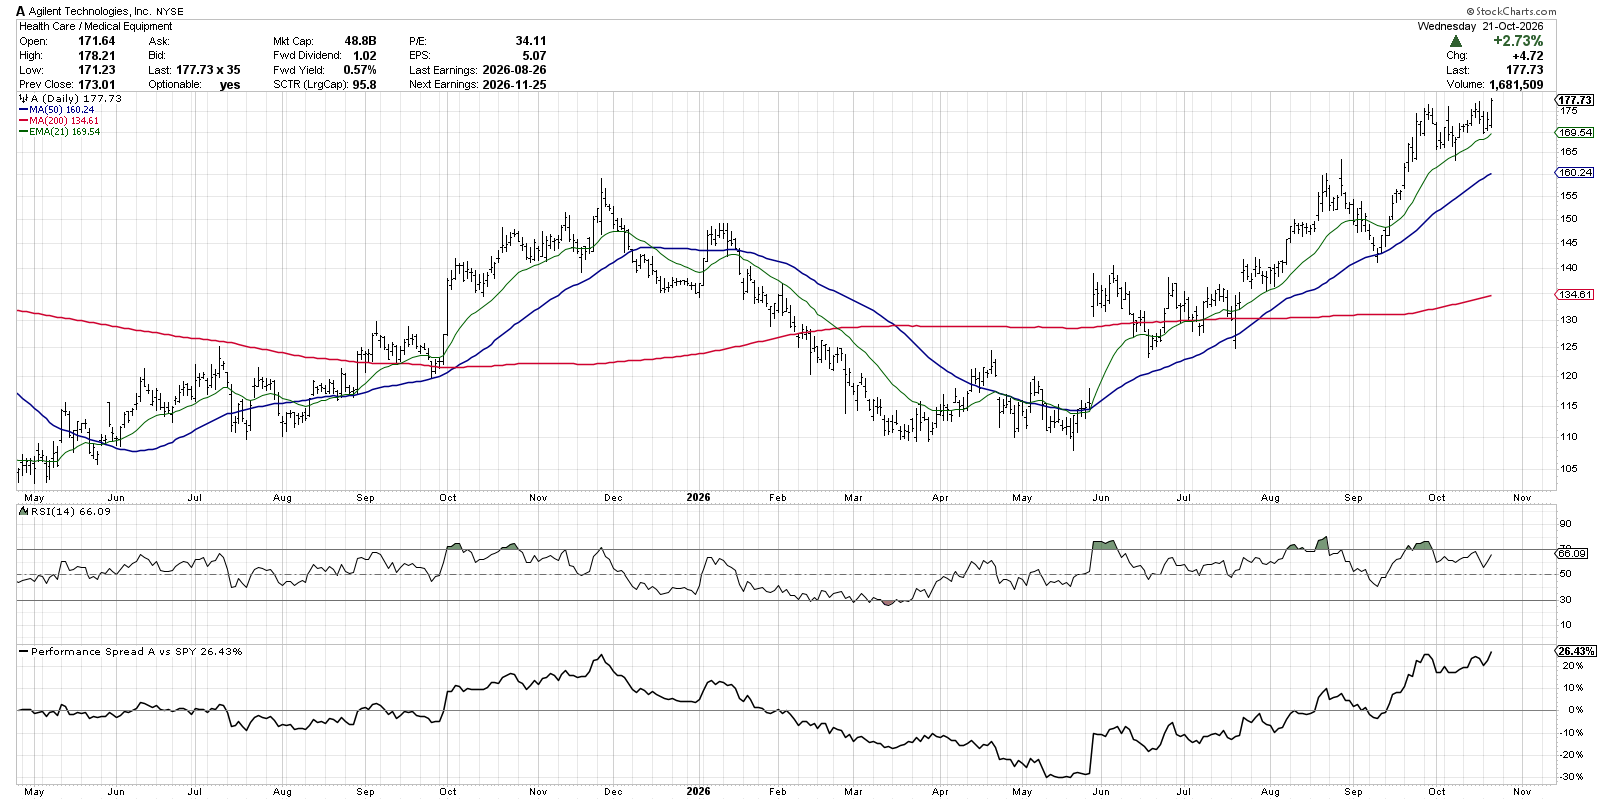
As I review the names from today’s scan, I’m finding three very consistent types of charts that tend to surface on the new three-month highs list. First, we have the “up and to the right” charts, i.e. the ones that have been working for a long time and just continue to work. Agilent (A) is a great example of this “long and strong” type of chart.
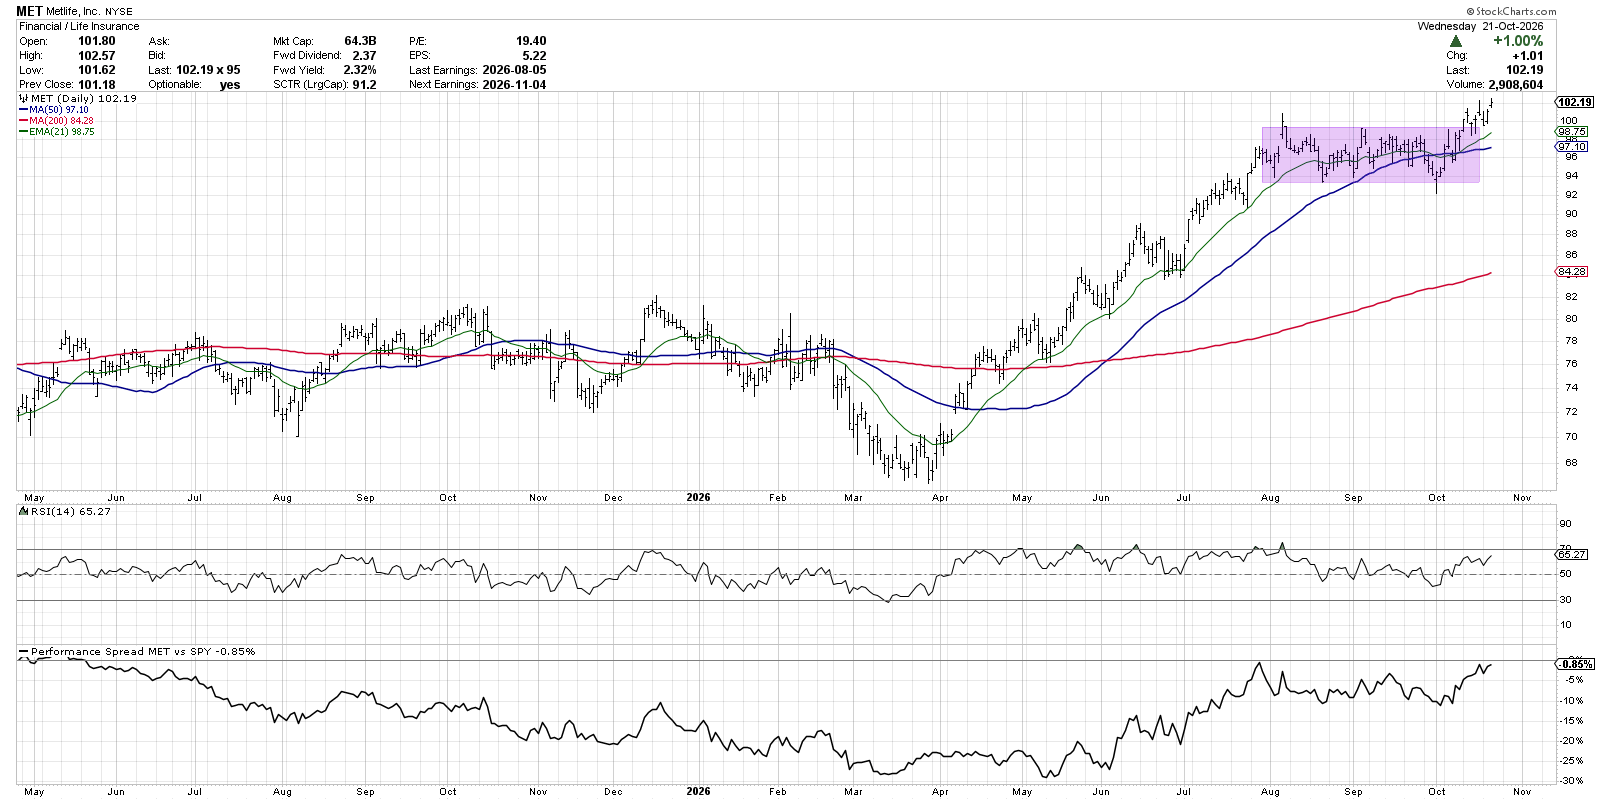
Next, we have the “new accumulation phase” charts, i.e. those that are exiting a recent consolidation pattern and appear to be beginning a new accumulation phase, marked by higher highs and higher lows. The chart of Metlife (MET) provides a great example.
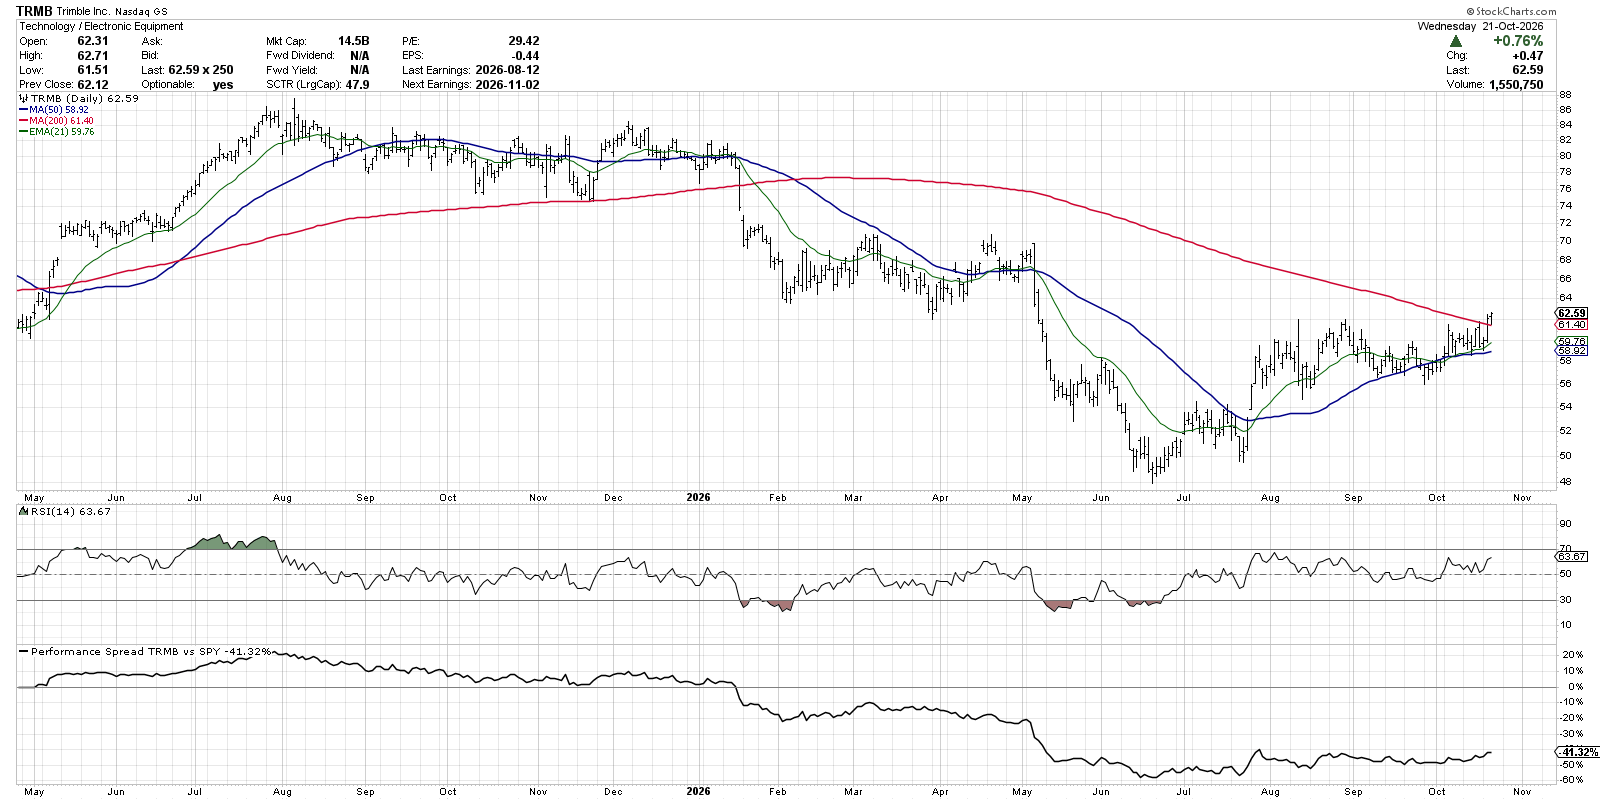
Some of my favorite charts are the ones that are just breaking above key moving averages. Here’s Trimble (TRMB) in the Technology sector, which is finally breaking above its 200-day moving average.
I’ve found that most of the results of this new high scan can be easily bucketed into one of these three main groups. And while I always want to know about stocks that have been in long established uptrends, the new breakouts are the actionable charts that I want to review immediately.
Identify Changes By Consistently Reviewing the Scans
The three most represented sectors in today’s scan are Health Care (12 stocks), Technology (7), and Financials (7). Earlier this year, I remember when the scan was filled with mostly AI plays, and before that it was mostly energy stocks. The changing results every week can be so valuable in helping to understand broader sector and group themes as they emerge.
Palantir (PLTR) was on the list many times through 2025. But starting in Q4 of last year, PLTR was no longer on the new three-month highs list, and it wasn’t until August 2026 that it once again appeared.
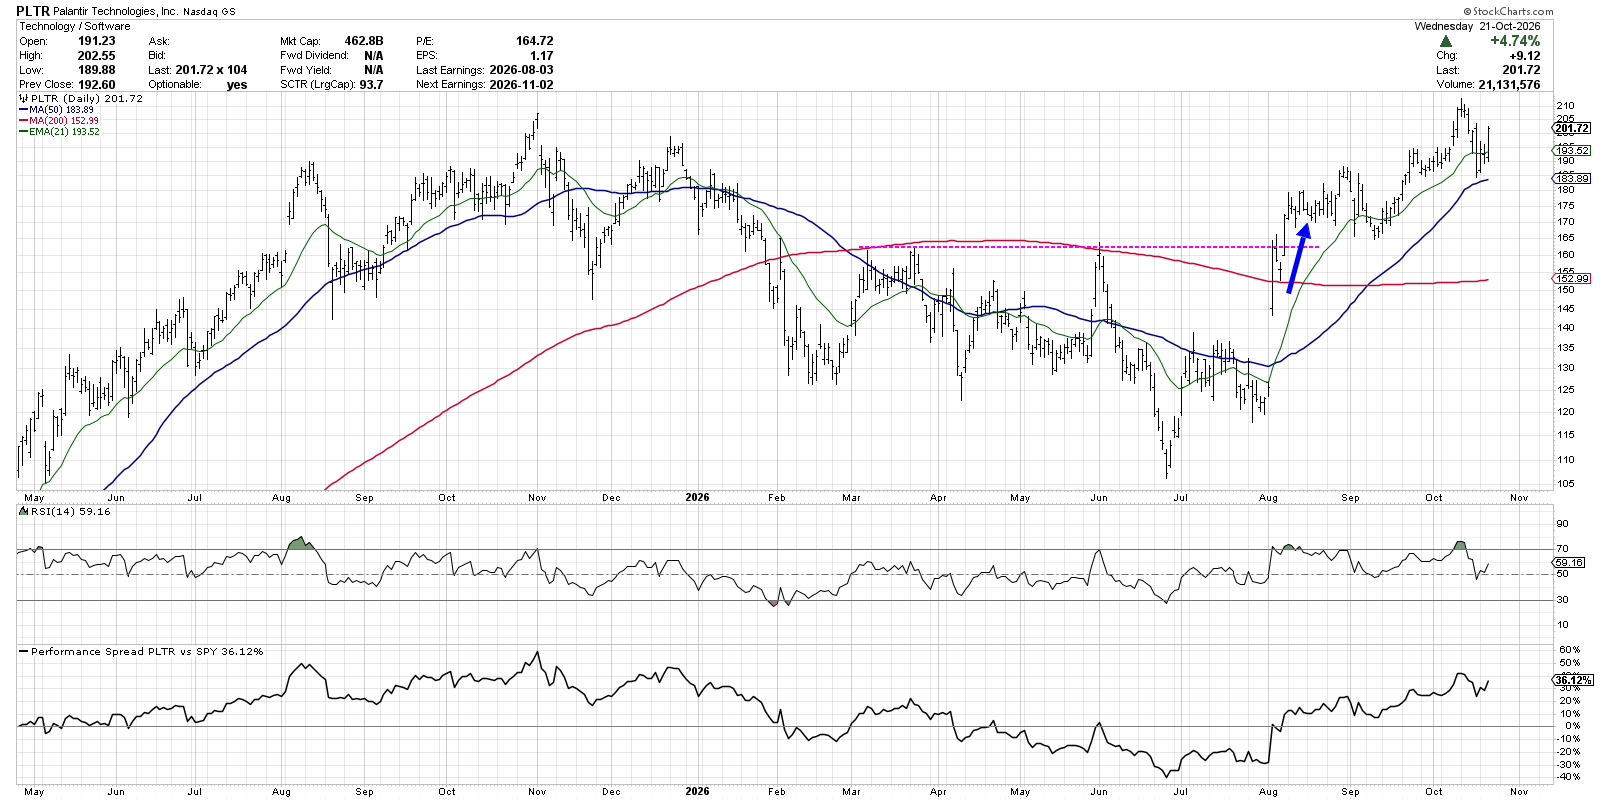
In this case, a new three-month high was confirmed with a break above the 200-day moving average. And with the RSI pushing above 60 through the breakout, we were able to confirm the strong momentum profile and determine a high likelihood of further upside for Palantir.
So it’s not about running a scan like this every once in a while, or just when you feel like it. It’s the consistency in running and reviewing the scan results that enables you to recognize changes and identify new leaders. As I often tell viewers of my daily market recap show, “An imperfect but consistent process is way better than a perfect but inconsistent process.”
Automation Helps You Acknowledge and Adapt
So how do we make a process like this more consistent? It’s all about automation. And once you’ve created a scan like this that helps you identify potential investment candidates, you can use the Scheduled Scans feature to set up a recurring list of results for your review.
I’d encourage you to set up some scheduled scans for breakouts and breakdowns, and pay close attention to the sectors and groups that are represented each week. At some point, the sectors listed above won’t be as widely populated on the list, and other sectors will be included. That shift in scan results could provide a powerful signal of a change in market leadership, and a reason to review your portfolio to make sure you’re positioned for what may come tomorrow!
By the way, the StockCharts Screener and Scheduled Scans were included as part of my recent video covering five hidden features of the StockCharts platform. You can review the other features over on the StockCharts TV YouTube channel!
RR#6,
Dave
P.S. Ready to upgrade your investment process? Check out my free behavioral investing course!
David Keller, CMT
President and Chief Strategist
Sierra Alpha Research LLC
marketmisbehavior.com
https://www.youtube.com/@DKellerCMT
Disclaimer: This blog is for educational purposes only and should not be construed as financial advice. The ideas and strategies should never be used without first assessing your own personal and financial situation, or without consulting a financial professional.
The author does not have a position in mentioned securities at the time of publication. Any opinions expressed herein are solely those of the author and do not in any way represent the views or opinions of any other person or entity.