The AI Rally Left Industrials Behind. Here’s Why That May Not Last

Key Takeaways
- Industrials have lagged the S&P 500 sharply this year, but technicals suggest a potential trend reversal.
- Jobs data and interest rates could provide the catalyst that cyclical areas need.
- Healthy sector rotation may reward investors looking beyond crowded AI trades.
Following the best manufacturing PMI data in four years, it’s jobs week on Wall Street. April and May labor market data might feel like an afterthought amid remarkable rallies in AI-related areas. Indeed, the Technology Select Sector SPDR ETF (XLK) is up more than 50% from its March 30 low and, within tech, the once-shunned, now-lauded iShares Expanded Tech-Software ETF (IGV) has cracked positive for 2026.
AI-Driven Leadership Is Never Set in Stone
The AI mega-theme has morphed over the last several quarters. Recall that it acted like Dr. Jekyll for software from last October to early April. Bullish Mr. Hyde then appeared shortly after the S&P 500’s low, allowing names like Oracle (ORCL), Microsoft (MSFT), and CrowdStrike (CRWD) to soar.
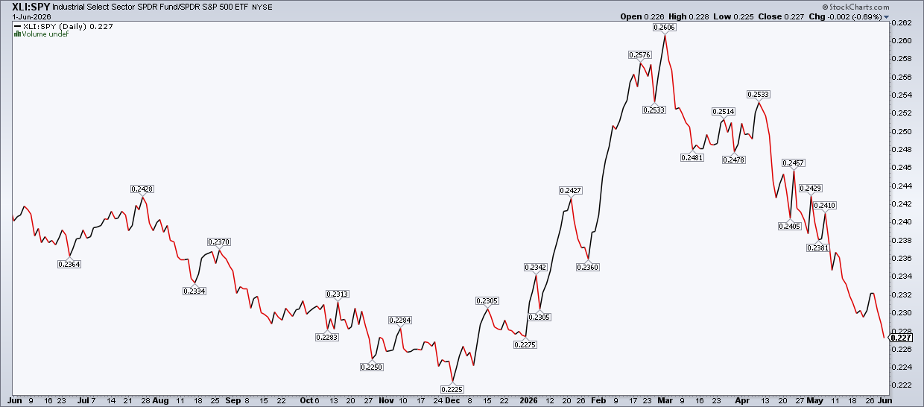
The opposite happened in Industrials. Nominal price action has been less extreme, but the Industrial Select Sector SPDR Fund’s (XLI) relative chart tells the tale. XLI:SPY tagged a YTD low just ahead of this week’s jobs data.
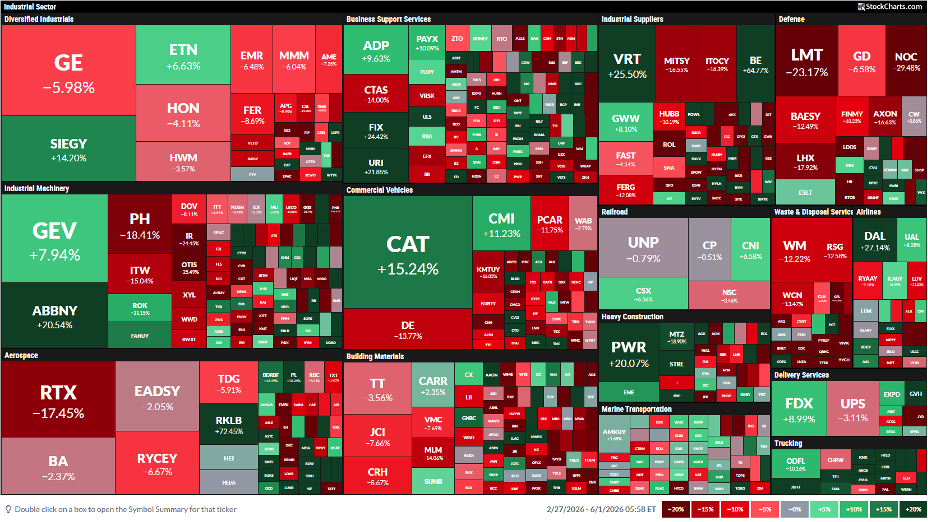
While Caterpillar (CAT) has purred fine with a 15%-plus gain over the past three months, there’s plenty of red on the Industrials performance heat map. GE Aerospace (GE), once considered a semi-AI play, is down 6% (16 percentage points of negative alpha) since early March.
Elsewhere in the defense industry, major losses in RTX Technologies (RTX), Lockheed Martin (LMT), and Northrop Grumman (NOC) have weighed on XLI.
Industrials Needs a Spark
Upcoming employment reports could be the next catalysts for cyclical sectors. They could use the help in this AI-, tech hardware-, and software-dominated market.
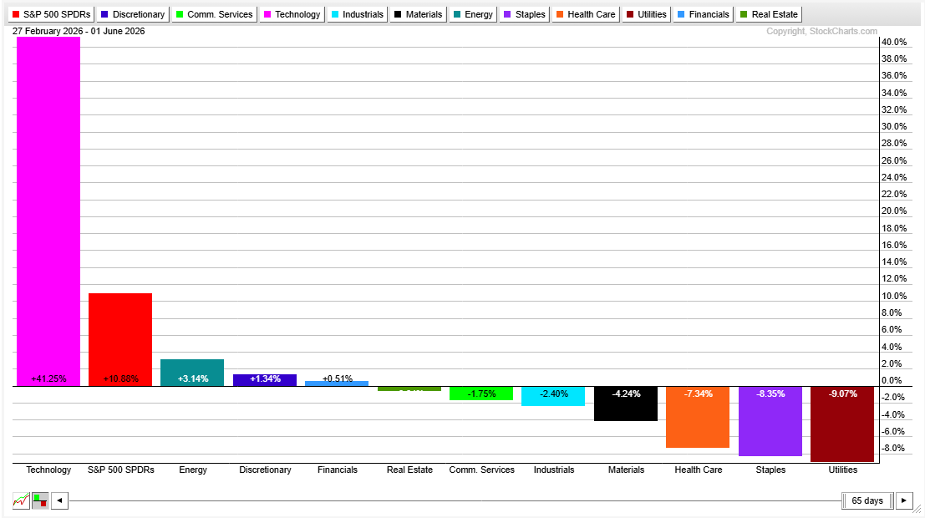
Since the war began, XLK has returned 41%, and the next-best sector (Energy) is up just 3%. In fact, seven of the 11 S&P 500 sector ETFs remain in the red since the start of March.
Industrials’ Chart Is Better Than the Headlines
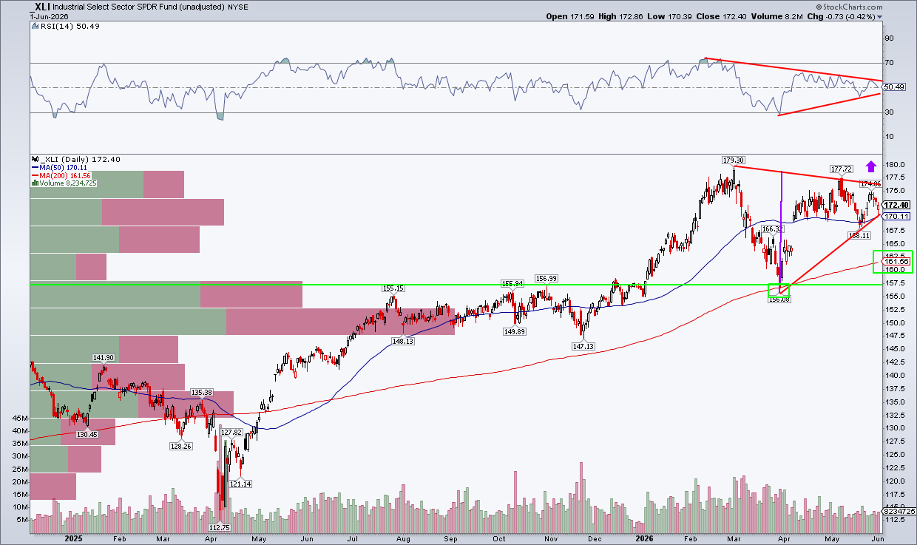
But let’s zoom in on Industrials. Notice in the chart below that the XLI chart is actually not bad-looking on its own. Sure, shares are materially below the March 2 all-time high of $179, but the $156 correction low looks durable. The long-term 200-day moving average, meanwhile, is on the rise, suggesting that the bulls control the primary trend, and XLI bulls defended price at that trend-indicator line at the March 30 market low.
Today, with plenty of economic data on tap and interest rates that have stopped backing up for now, a series of lower highs and potentially higher lows makes for a symmetrical triangle setup heading into summer.
An XLI Breakout Would Target $200
The bull case goes like this: a rally above $178 would trigger a measured-move upside price objective to near $200, based on the height of the formation at its onset, added to the breakout point. It's important to remember that triangles are continuation patterns (not reversal signatures), meaning the trend of larger degree (higher, in XLI’s case) is presumed to persist.
It’s also key to take signals from the RSI momentum oscillator at the top of the chart. Like price, the RSI line is consolidating. Momentum is thought to make its move before price, so ETF traders should monitor it for early clues.
And even if we do see protracted summer selling, there’s a high amount of volume by price down in the mid-$100s, which should offer cushioning on a pullback. The mid-$150s, specifically, are a point of polarity. Closer to the current price, a gap lingers at $164 that, if filled, could lead to a retest of the 200-day moving average.
Can AI Lift Industrials Next?
I mentioned IGV at the outset, and I would not be surprised to see AI come to XLI’s rescue in the months ahead. It might take some macro help, such as easing interest rates and cooling inflation expectations, but this cycle has shown that while tech has been the obvious winner, AI’s positive impact tends to knock on the doors of other industries over time.
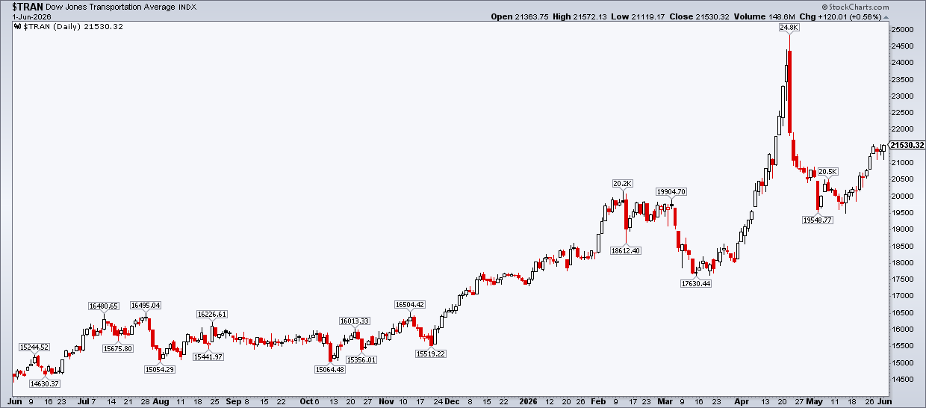
Under the Industrials sector’s hood, we find that the Dow Jones Transportation Average ($TRAN) is at record highs, if not for the meme stock frenzy around Avis Budget Group (CAR) in mid-to-late April. Along with the Dow Jones Industrial Average cranking out one new high after another, blue chips are by no means out of favor.
Sector Rotation Used to Be a Thing...
In bull markets, you want to look for setups like this. Sector rotation develops in a healthy way, handing the baton to new leaders for a season while leaders take a rest. It’s also a potential risk-management technique. After all, 10 S&P 500 stocks have doubled in just the last three months, all with the same thematic underpinnings.
Should momentum sway, money could flow into previous winning areas (recall that Industrials was the No. 1 SPX sector from February 2025 to February 2026).
The Calendar Points to Patience
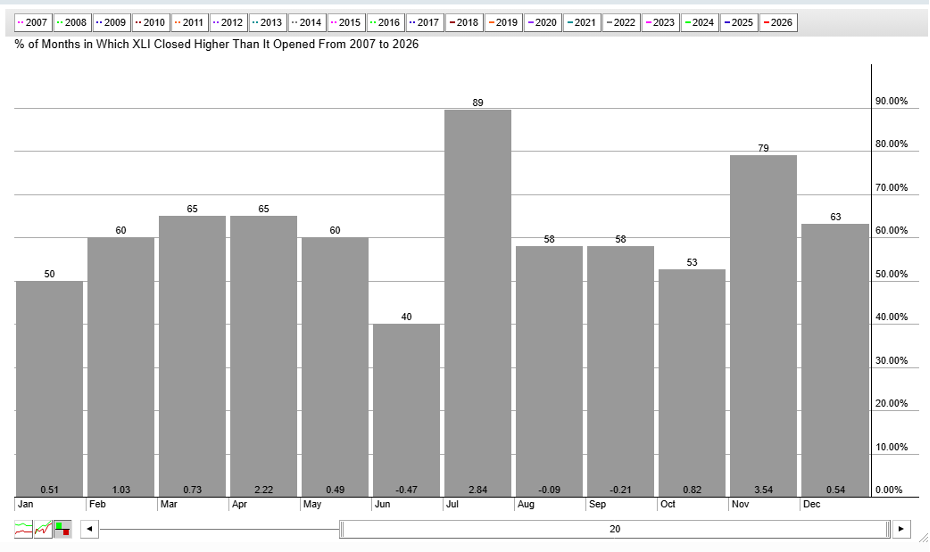
Unfortunately, seasonality is not sanguine. Since 2007, June has been XLI’s worst month. Averaging a 0.47% decline, the positivity rate is a mere 40%; the trend augurs for a cautious stance before midyear. July has been exceptionally bullish, though, up 89% of the time with an average gain of 2.84%.
The Bottom Line
The war in Iran did no favors for the Aerospace & Defense industry within the Industrials sector. XLI fell to a fresh YTD low versus the S&P 500 to kick off June, and this week’s bevy of macroeconomic data may offer a trading catalyst. But the chart is somewhat constructive following a months-long consolidation. For traders looking to manage risk, taking profits in red-hot AI names in favor of seemingly forgotten Industrials could be a prescient move.
Ready to see the market through a wider lens? Head to the Market Summary page and dive into the Intermarket Analysis panel for a real-time read on stocks, bonds, commodities, oil, gold, and the dollar — all in one place.
Disclaimer: This blog is for educational purposes only and should not be construed as financial advice. The ideas and strategies should never be used without first assessing your own personal and financial situation, or without consulting a financial professional.