Too Much AI in EM? Emerging Markets Investors Face a Key Decision

Key Takeaways
- AI-driven gains in Taiwan and South Korea have fueled absolute and relative gains in EEM and IEMG.
- A major technical target was reached in IEMG, raising the odds of consolidation heading into mid-year.
- A lower-volatility EM ETF alternative may offer more diversified exposure without abandoning emerging markets.
The AI trade may be confined to tech lately, but it has spread geographically. Four months ago, I outlined a long play on emerging markets. The iShares Core MSCI Emerging Markets ETF (IEMG) had already gained 44% over the previous 12 months, but technical momentum was strong, with leadership stemming from its largest components: Taiwan Semiconductor (TSM), Samsung, and SK Hynix.
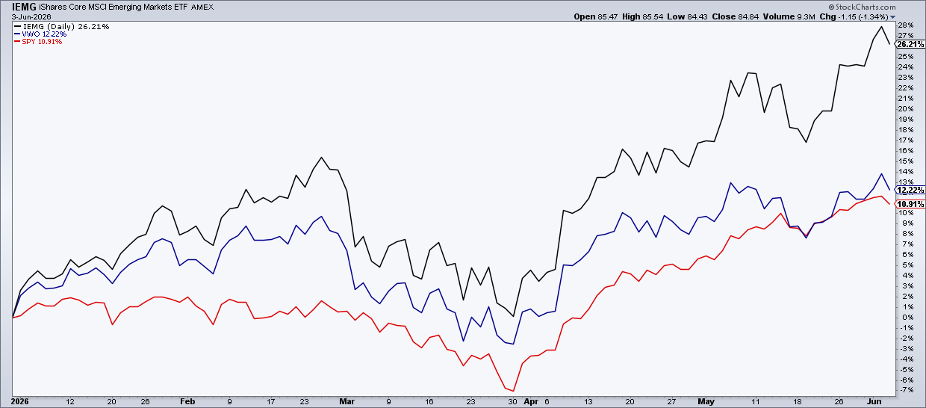
Absolute and relative gains have continued. Year-to-date, IEMG is up 24%, compared to a 10% total return for the S&P 500 ETF (SPY). It has been anything but a carefree ascent, though.
As mid-year approaches, the core emerging markets ETF sports an implied volatility reading of 32%, which is about twice that of the S&P 500 ($SPX). Indeed, each morning, swing traders brace themselves for U.S. ETF responses to wild price action in South Korea and Taiwan.
Time to Play Defense in EM?
Maybe you’re looking to reduce your market risk, book some 2026 gains, or simply play some defense as the AI theme rages one day, then rattles markets the next. Did you know you can do that while still maintaining your EM exposure?
The Vanguard Emerging Markets ETF (VWO) is a less-sexy, lower-volatility product. Up just 11% so far in 2026, Vanguard’s EM fund does not hold South Korean equities, so two trillion-dollar behemoths (Samsung and SK Hynix) are absent from the portfolio. That has resulted in unusually severe underperformance relative to IEMG. Zoom out on the performance chart over many years, however, and we find that total returns were comparable between the two low-cost funds from 2012 through 2024.
So, with IEMG having neared my initial technical target in the $87–$88 range, swapping it out for VWO seems reasonable. Let’s investigate both charts to see where opportunities lie.
IEMG: Fibonacci Resistance In Play
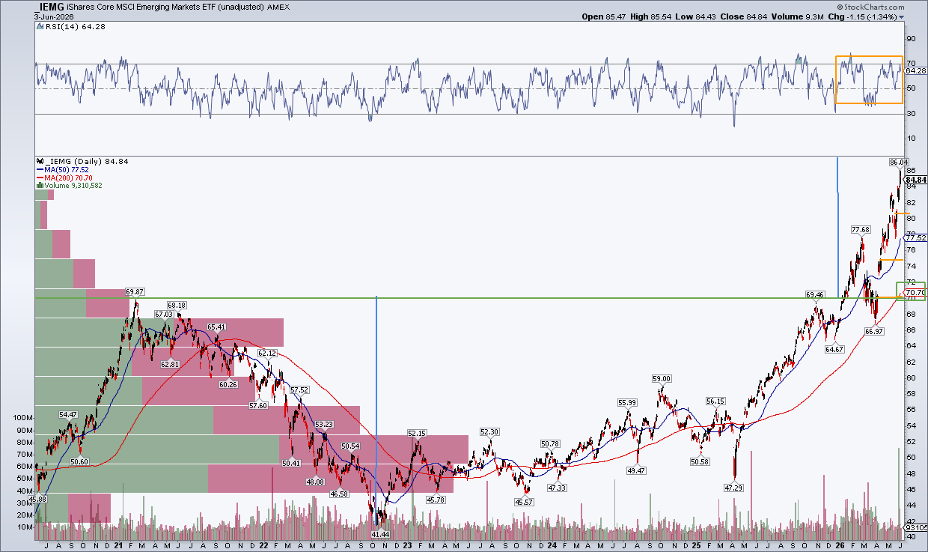
Beginning with IEMG, the primary feature I detailed in February was a measured-move upside price target of first $87, then $98, based on the depth of the 2021–2025 bear market and subsequent breakout. The ETF tagged $86 earlier this week and has since retreated. $87 remains the 161.8% Fibonacci extension target of the multi-year consolidation.
Notice in the chart below that IEMG is still doing most of the right things. Its long-term 200-day moving average is rising, suggesting that the bulls control the primary trend. The RSI momentum oscillator at the top of the chart has not touched technical oversold conditions in 14 months, and there are simply clear skies above the $86 all-time high, meaning there is no overhead supply.
An Age-Old Technicians’ Debate: Gaps
With often sizable pre-market swings, gaps linger. $80.60, $74.90, and $70.30 are just a few. That prompts a debate among technicians: Since IEMG is partly made up of international stocks that trade during off-hours compared to domestic equities, are they merely "common" gaps we can safely ignore? Or do they matter because IEMG is among the most widely-traded index ETFs in the U.S.? I say that they do carry some significance.
Ultimately, the chart is constructive on an intermediate timeframe, but with the Fibonacci level reached, we may see the bears engage in some gap-filling this summer.
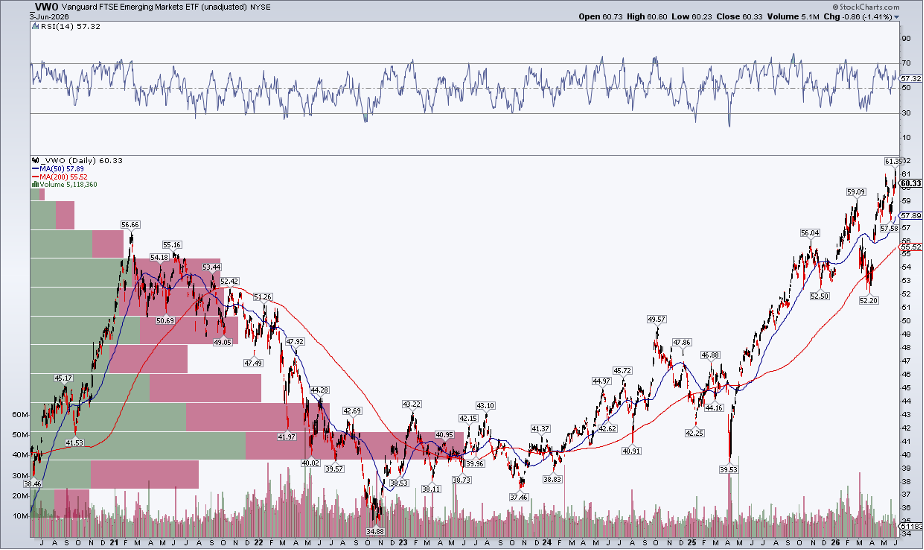
Vanguard Emerging Markets ETF: Slower, Steadier, Less AI
Turning to VWO, its underperformance relative to IEMG is striking even without a comparative SharpChart. The Vanguard EM ETF is only a few bucks above its early 2021 peak, while RSI sits at a more neutral mid-50s level, rarely scaling 70 this year.
Despite some modest bearish divergence between price and momentum, the chart is still moving up and to the right, with the long-term 200-day moving average helping confirm an upcycle. Here, we find firmer support near $52, while a major gap sits just above that at $54. Overall, it is a less dramatic setup.
Less AI Has Cost VWO, But is that All in the Past?
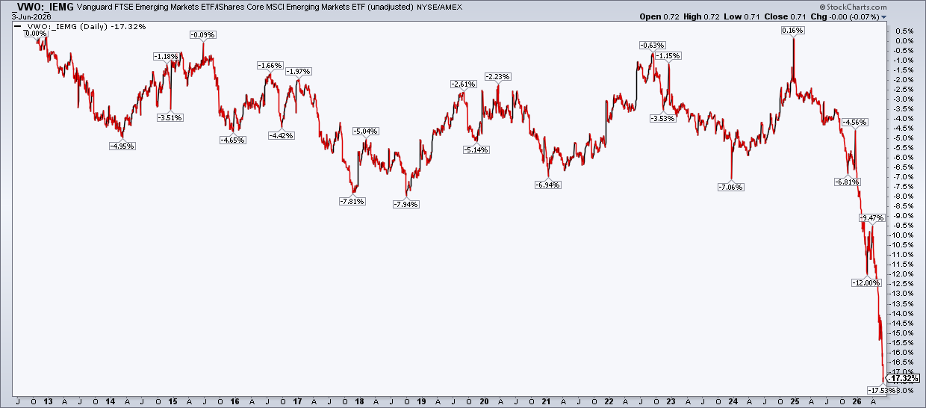
What is eye-popping, though, is VWO versus IEMG. It doesn’t take a CMT to spot the unraveling of what was once a rather tight EM tandem.
From IEMG’s inception in 2012 through mid-2025, the EM plays moved largely in lockstep, drifting just 5%–10% apart at times. But the major chip and memory stocks in the Far East began ripping in earnest in Q3 last year. The result was VWO trailing IEMG by more than 20 percentage points.
So, is mean reversion at hand? Or should investors remain guns blazing and long IEMG? From a pure alpha perspective, the relative chart argues for IEMG.
China & India Need to Get Off the Mat for VWO to Beat IEMG
Overall, I expect a healthy reset in IEMG, given that the technical target has been hit. VWO would almost certainly come under pressure, too, but its losses may be less severe.
For VWO to really turn the corner, both on an absolute and relative basis, we would need to see China and India gain ground. They have been left in the dust by Taiwan and South Korea.
This brings us to a key point about bull markets: Rotation happens among sectors and among countries. A pause in EWT and EWY uptrends may favor FXI and INDA. That is something I’ll be watching heading into the second half.
The Bottom Line
Emerging markets have ripped alongside U.S. tech and AI stocks. IEMG is now 37% allocated to the Information Technology sector… indeed, this is not your father’s emerging markets. Technical signals suggest a pause in IEMG’s bull market. Swapping into the less-volatile VWO could be an alpha-generating trade if a protracted consolidation plays out.
Ready to compare ETFs like a pro? You can overlay symbols, switch to performance mode, and analyze relative strength directly in SharpCharts. If you want step-by-step guidance, just drop "How do I compare the performance of two ETFs?" into the "Ask a Question" search found under Help, and the Chat Assistant will handle the rest.
Disclaimer: This blog is for educational purposes only and should not be construed as financial advice. The ideas and strategies should never be used without first assessing your own personal and financial situation, or without consulting a financial professional.