The Best Five Sectors This Week #69
Key Takeaways
- Technology remains the leading sector despite a sharp decline, with strong relative strength and a positive heading on weekly and daily RRG charts.
- Energy, Materials, and Real Estate show sideways movement, with potential for recovery based on daily RRG trends.
- Consumer Discretionary climbed to sixth place, while Communication Services dropped to the bottom of the sector rankings.
- Portfolio performance weakened slightly last week.
Tanking Tech Sets Portfolio back 1.5%
After a significant decline, particularly in technology stocks on Friday, the S&P 500 ($SPX) ended the week with a loss of over 2%. Despite this drop, the sector rotation and rankings among the top five sectors remained relatively stable, with only minor changes. However, the bottom half of the sector list saw more notable shifts.
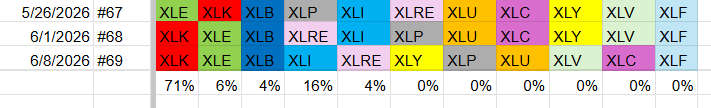
In the top five, Industrials and Real Estate swapped places, with Industrials now at position four and Real Estate at five. The top three sectors — Technology, Energy, and Materials — remained unchanged. Technology continues to lead, followed by Energy and Materials.
The bottom half of the sector list experienced more significant movement:
- Consumer Discretionary jumped from position nine to six.
- Consumer Staples dropped from six to seven.
- Utilities moved down from seven to eight.
- Health Care climbed from 10 to nine.
- Communication Services fell from eight to 10.
- Financials stayed at the bottom.
- (1) Technology - XLK [71%]
- (2) Energy - XLE [6%]
- (3) Materials - XLB [4%]
- (5) Industrials - XLI [16%]*
- (4) Real Estate - XLRE [4%]*
- (9) Consumer Discretionary - XLY*
- (6) Consumer Staples - XLP*
- (7) Utilities - XLU*
- (10) Health Care - XLV*
- (8) Communication Services - XLC*
- (11) Financials - XLF
Weekly RRG
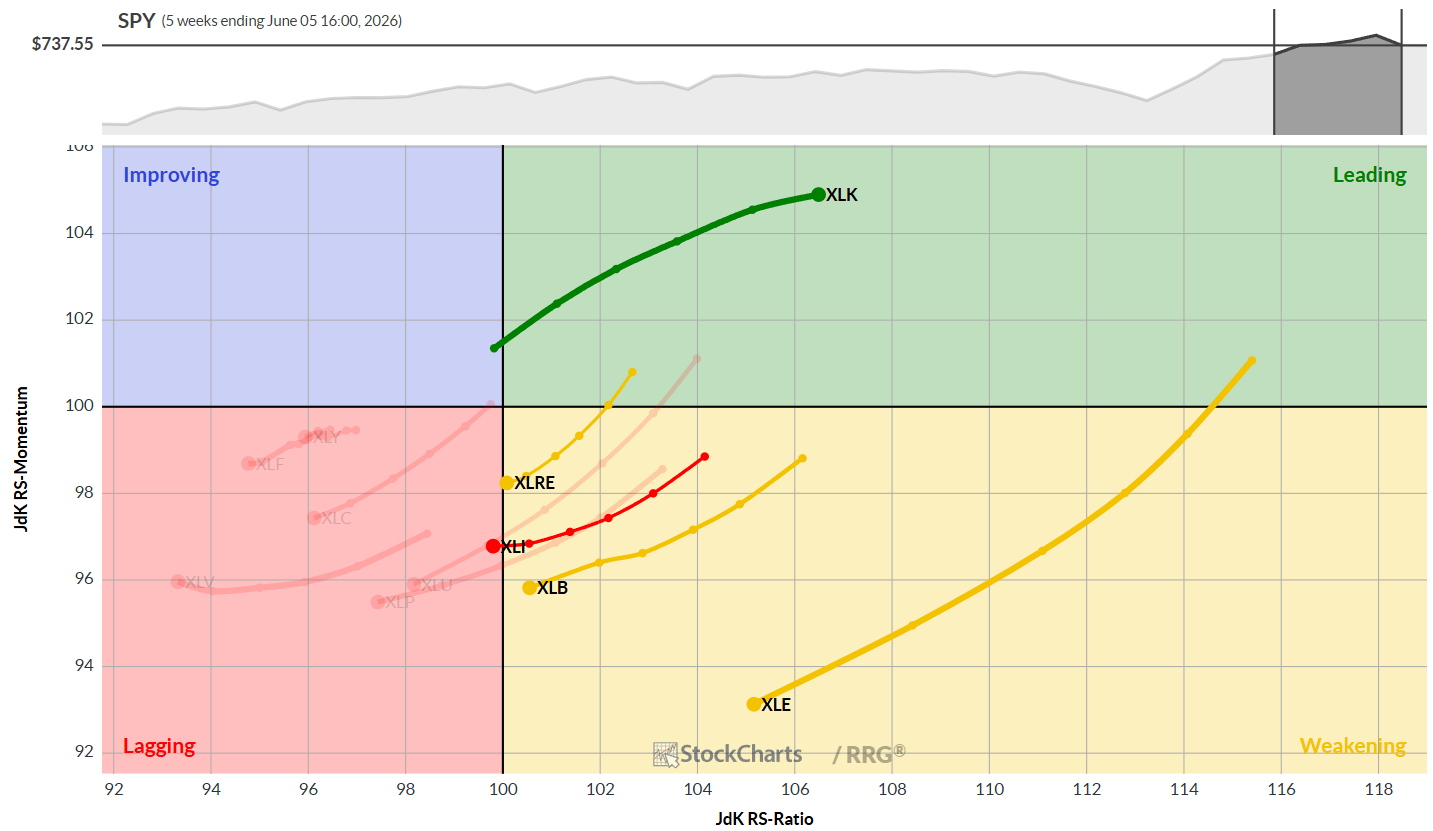
At the close of last Friday, the weekly Relative Rotation Graph (RRG) showed a familiar picture. Technology remains the only sector in the leading quadrant, maintaining a positive heading despite the recent decline. The other four sectors in the top five are all moving at a negative heading.
Industrials has crossed into the lagging quadrant, while Real Estate and Materials are close to doing the same. Energy, with a long tail, remains on the right side of the graph in the weakening quadrant, but its negative trajectory suggests further weakness may be ahead.
Daily RRG
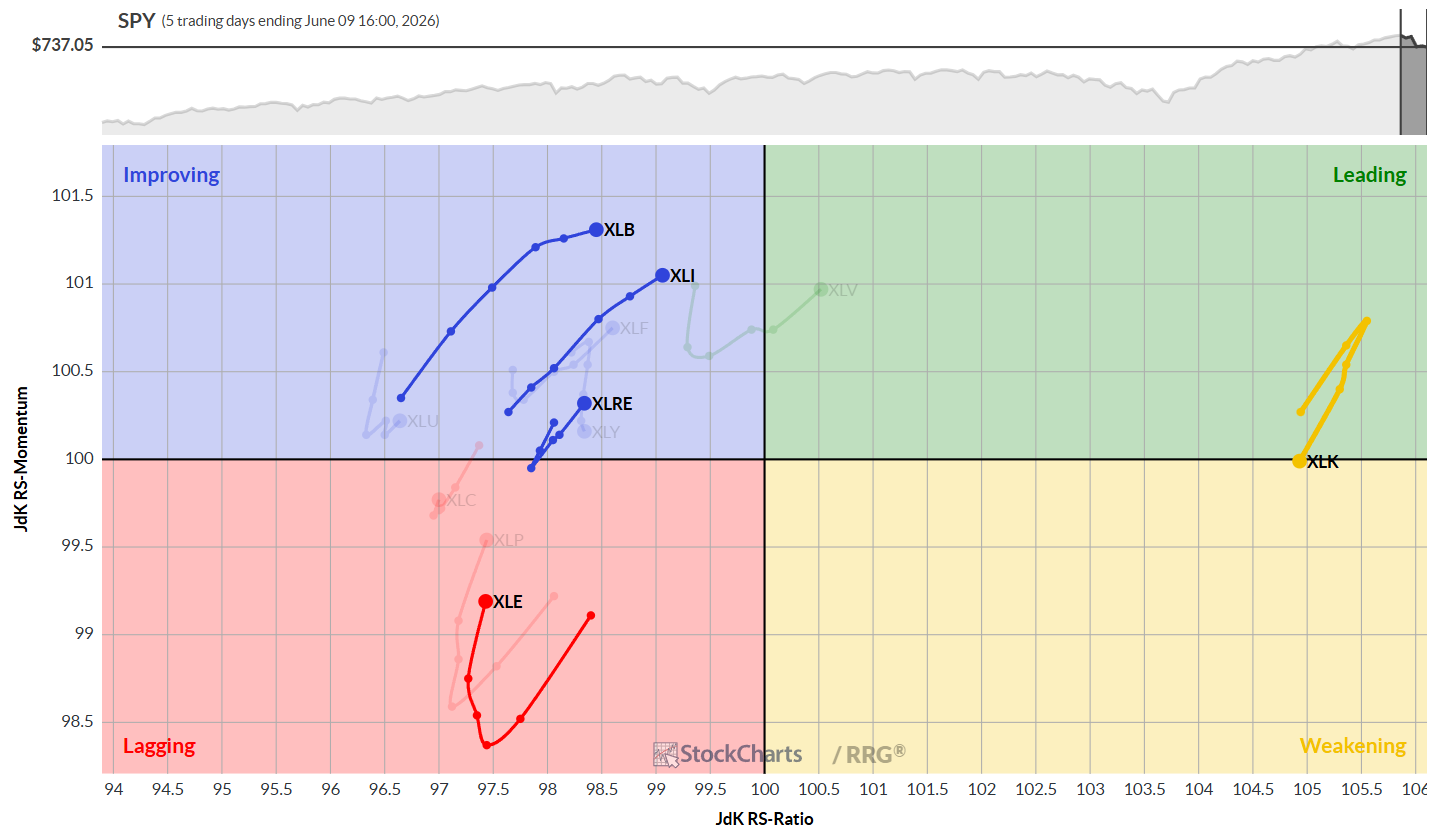
The daily RRG offers a more optimistic outlook for the top five sectors. Technology maintains a high RS Ratio reading, with potential for a leading rotation that aligns with the weekly RRG. The other four sectors — Materials, Industrials, and Real Estate — are back on a positive heading and are already in the leading quadrant. Energy, still in the lagging quadrant, has curled upward and is moving toward the improving quadrant. If this daily rotation persists, it could cause the weekly chart tails to curl up in the coming weeks, which would be positive for the top five sectors.
Sector Highlights
Technology
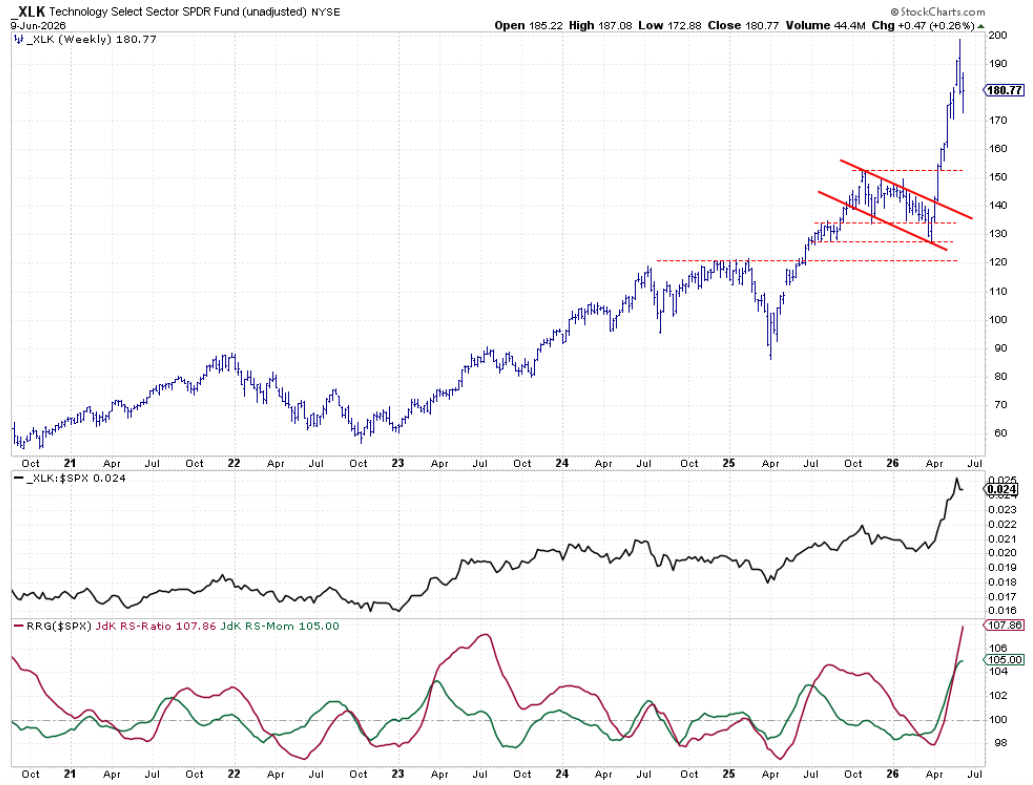
The Technology sector continues to show strength, despite a bearish reversal last week and some follow-through in recent days. The overall chart remains robust, including the raw relative strength line and RRG lines. The XLK chart has room to correct without damaging the price or relative trend.
Energy
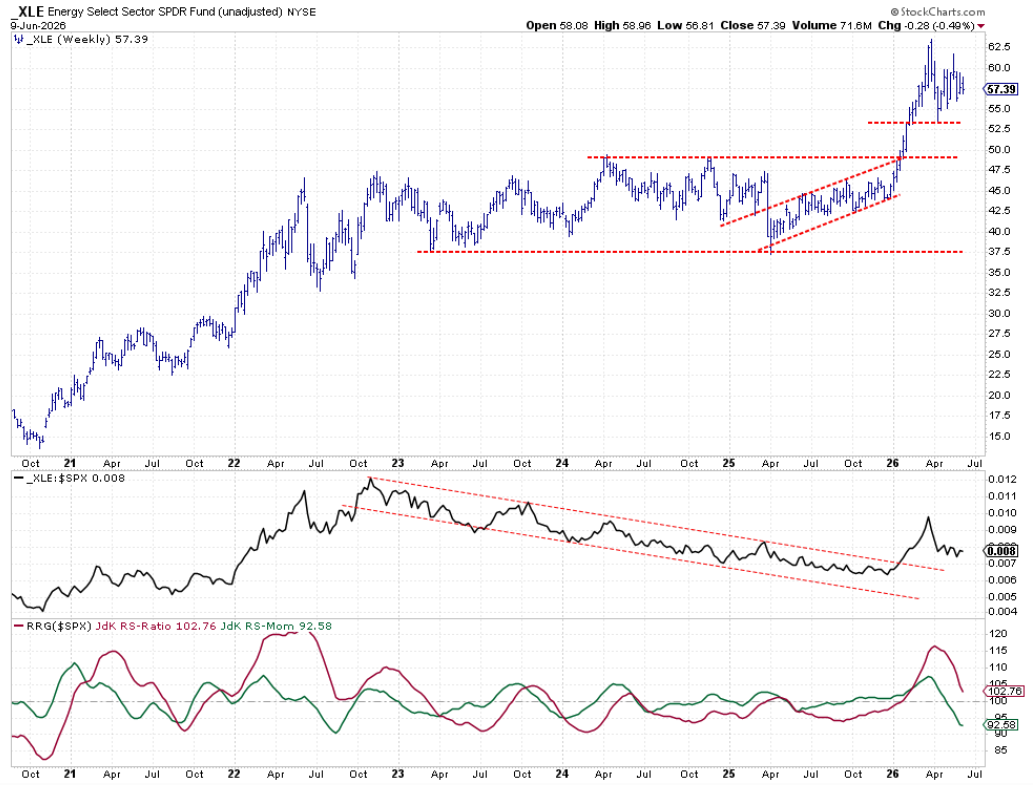
Energy is moving sideways, possibly forming a triangle pattern. The overall picture is positive, suggesting consolidation within an uptrend. The raw RS line has stalled, and RS is now moving sideways. RRG lines are still declining, with RS-ratio above 100 and RS-momentum pulling lower. Improvement in relative strength is needed for the RRG lines to curl back up.
Materials
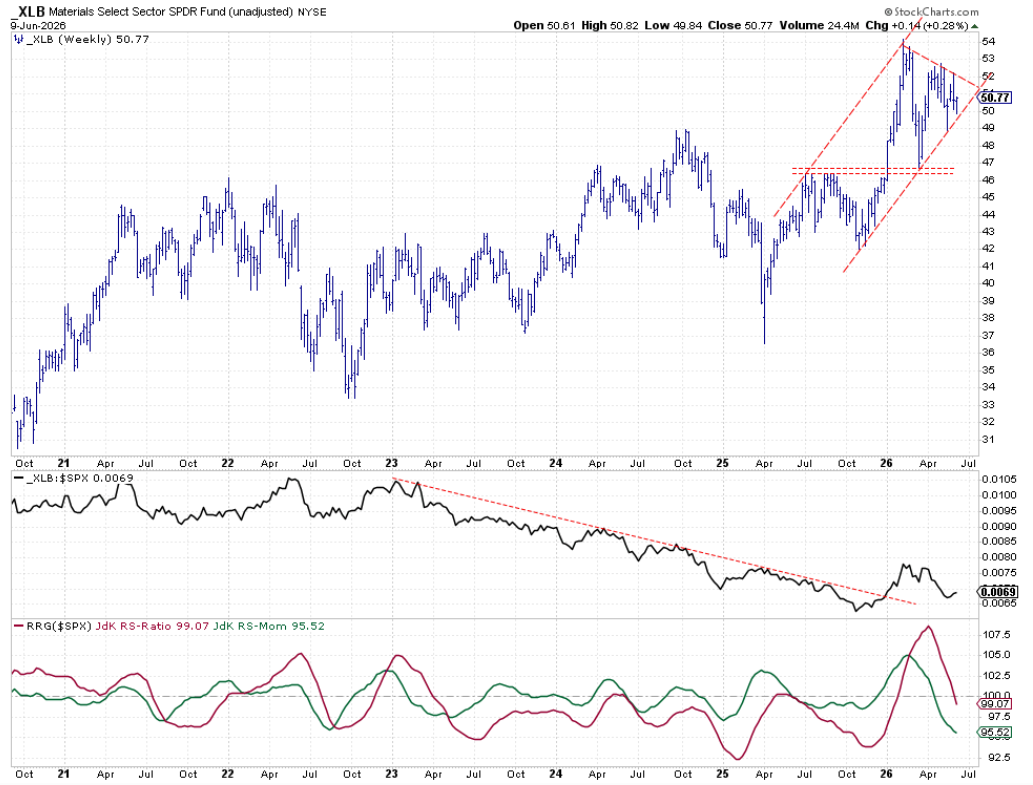
Materials show a similar pattern to energy, with the price chart in an uptrend but moving sideways, forming a triangle. The raw RS line is seeking new support after a double top. RRG lines are moving lower, positioning the XLB tail in the lagging quadrant, but the decline is slowing. Combined with daily RRG improvement, XLB may be poised to set a new higher low.
Real Estate
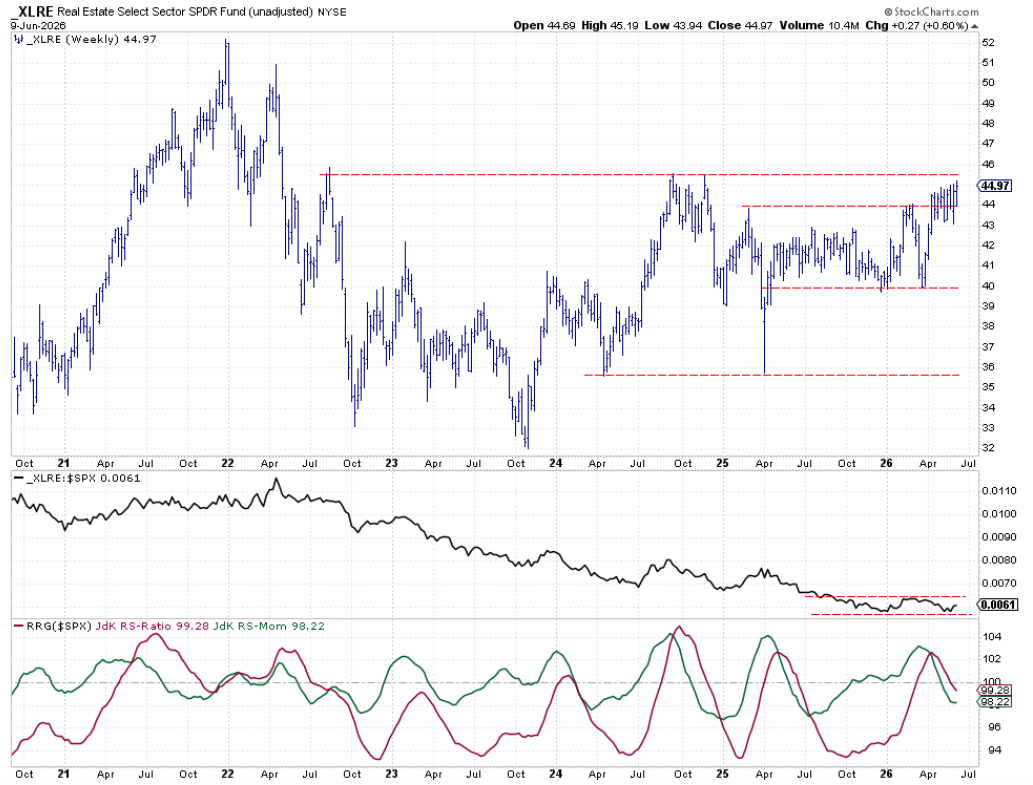
Real Estate’s price chart is gradually inching higher, nearing overhead resistance just above 45. Breaking this level would signal further gains. The relative strength chart is moving sideways, finding support at the same level as the start of the year, which could lead to a bottoming formation. RRG lines are still moving lower, but RS-momentum has leveled off and is forming a new low, potentially pulling the RS-ratio higher and confirming a positive outlook.
Portfolio Performance
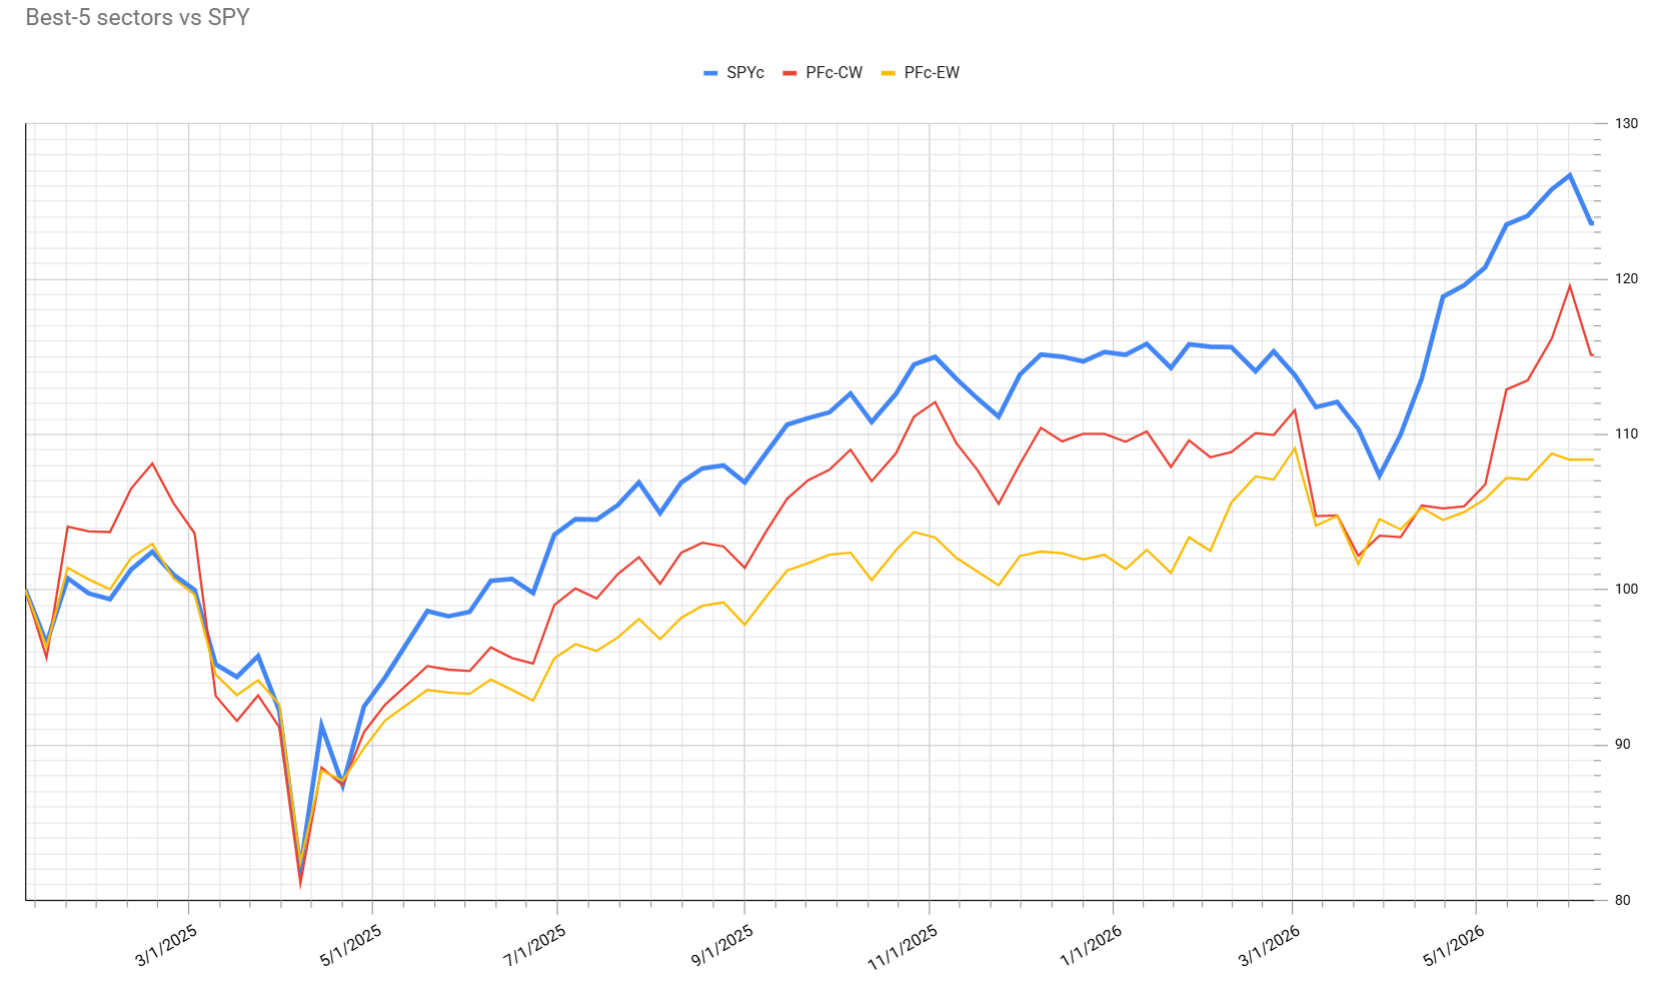
Last week’s portfolio performance was mildly negative, despite a 6% decline in tech on Friday and the overall S&P 500 drop. The portfolio ended the week at minus seven, widening the gap by about 1%. This is still much better than the minus 14 from a couple of weeks ago. The strategy continues to monitor the top five sectors based on the Relative Rotation Graph ranking, combining weekly and daily data.
Conclusion
While Technology remains strong, other sectors are showing signs of improvement, especially on the daily RRG. Continued monitoring of these trends will be crucial for portfolio performance in the weeks ahead.
#StayAlert. --Julius