Using SCTR and Breakout Scans to Uncover Hidden Gems

Key Takeaways
- Combining three-month breakout scans with low SCTR scores can help identify stocks that are earlier in their uptrend phases.
- Charts showing higher highs, higher lows, and improving momentum may offer promising setups before they become overextended.
- Dave presents a scan that can uncover emerging opportunities outside crowded growth areas, especially in value and defensive sectors.
I generally subscribe to a momentum-based investment approach, looking for stocks and ETFs demonstrating strong relative performance. As a trend follower, my goal is to identify charts in confirmed uptrends, then follow those trends as long as the trend remains constructive.
On a recent episode of my daily market recap show, I was asked whether there was a time when I’d look for weaker stocks according to the StockCharts Technical Ranking (SCTR) score. As this proprietary momentum model is based on price trends over multiple time frames, I’m generally looking for charts with higher SCTR scores. But I’ve also found that, by combining a three-month breakout scan with a parameter for lower SCTR-ranked names, I’m able to identify charts that are a bit earlier on in their uptrend phases.
Today, I’ll share with you how I combine these factors to generate a working list of charts and walk through some of the specific patterns to keep in mind.
Here’s the scan to identify breakout names with low SCTR scores, and you can simply copy and paste this into the StockCharts scan engine to generate your own list of names.
[type = stock]
and [[exchange = NYSE] or [exchange = NASD]]
and [group is not ETF]
and [market cap > 5,000]
and [Weekly Close > Last Week's MAX(13,Close)]
and [SCTR < 50]
Those final two lines are the heart of this scan, starting with stocks where the current weekly close is higher than the last 13 weekly closes. Basically, I’m looking for stocks making a new three-month high, based on weekly closing data.
When it comes to a basic “new 13-week highs” scan, the challenge is that you’ll get charts like Micron (MU) that have been in primary uptrends for months and months.
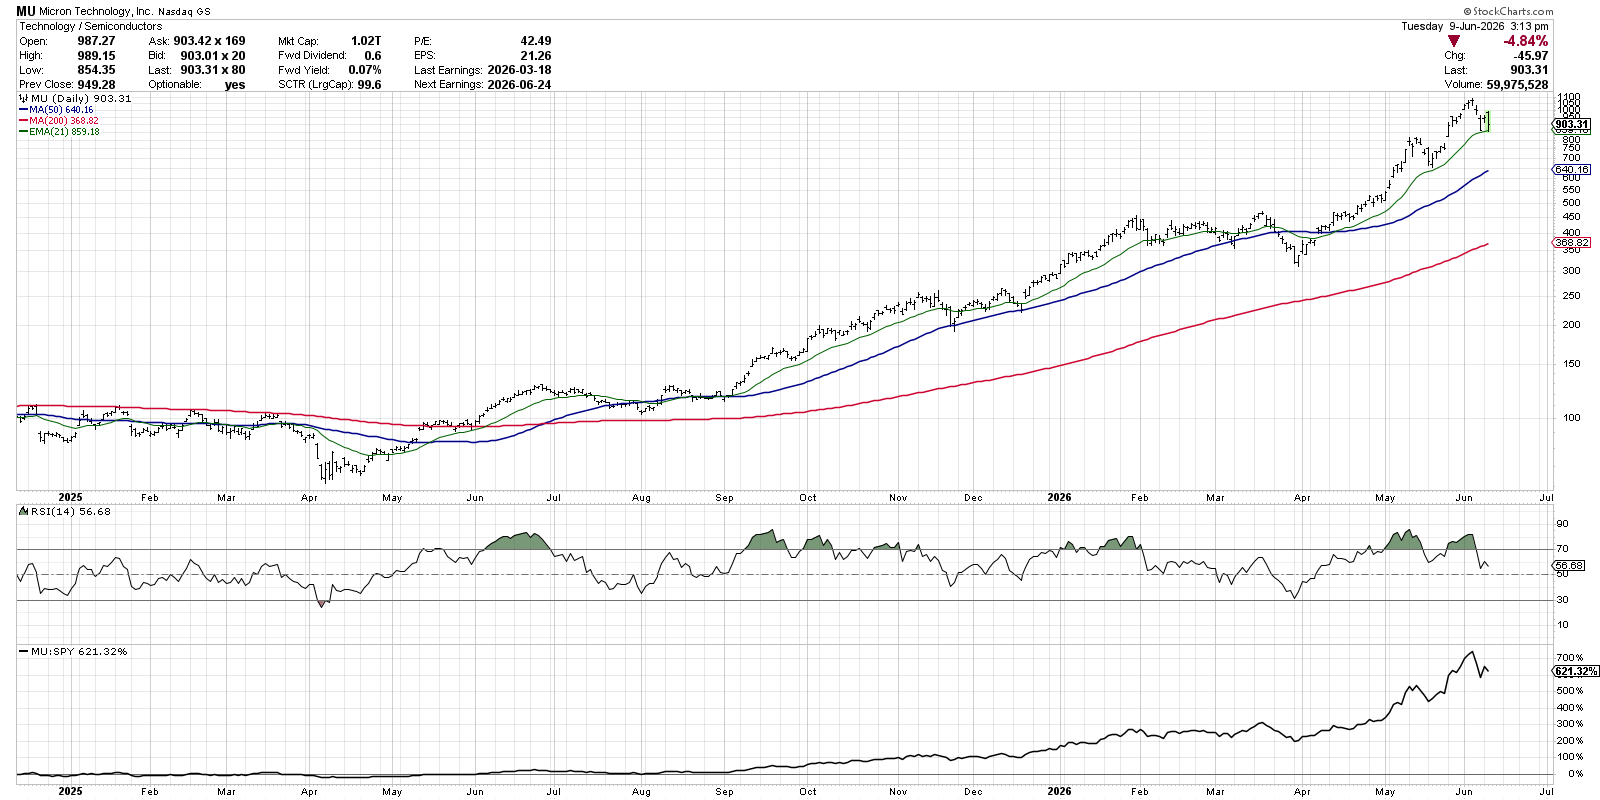
So, to avoid such charts, we'll add one final line to the scan: and [SCTR < 50]. Now we’re limiting the universe to stocks with a SCTR ranking below 50, which means we’re eliminating stocks in established uptrends and focusing more on charts that are earlier in their accumulation phase.
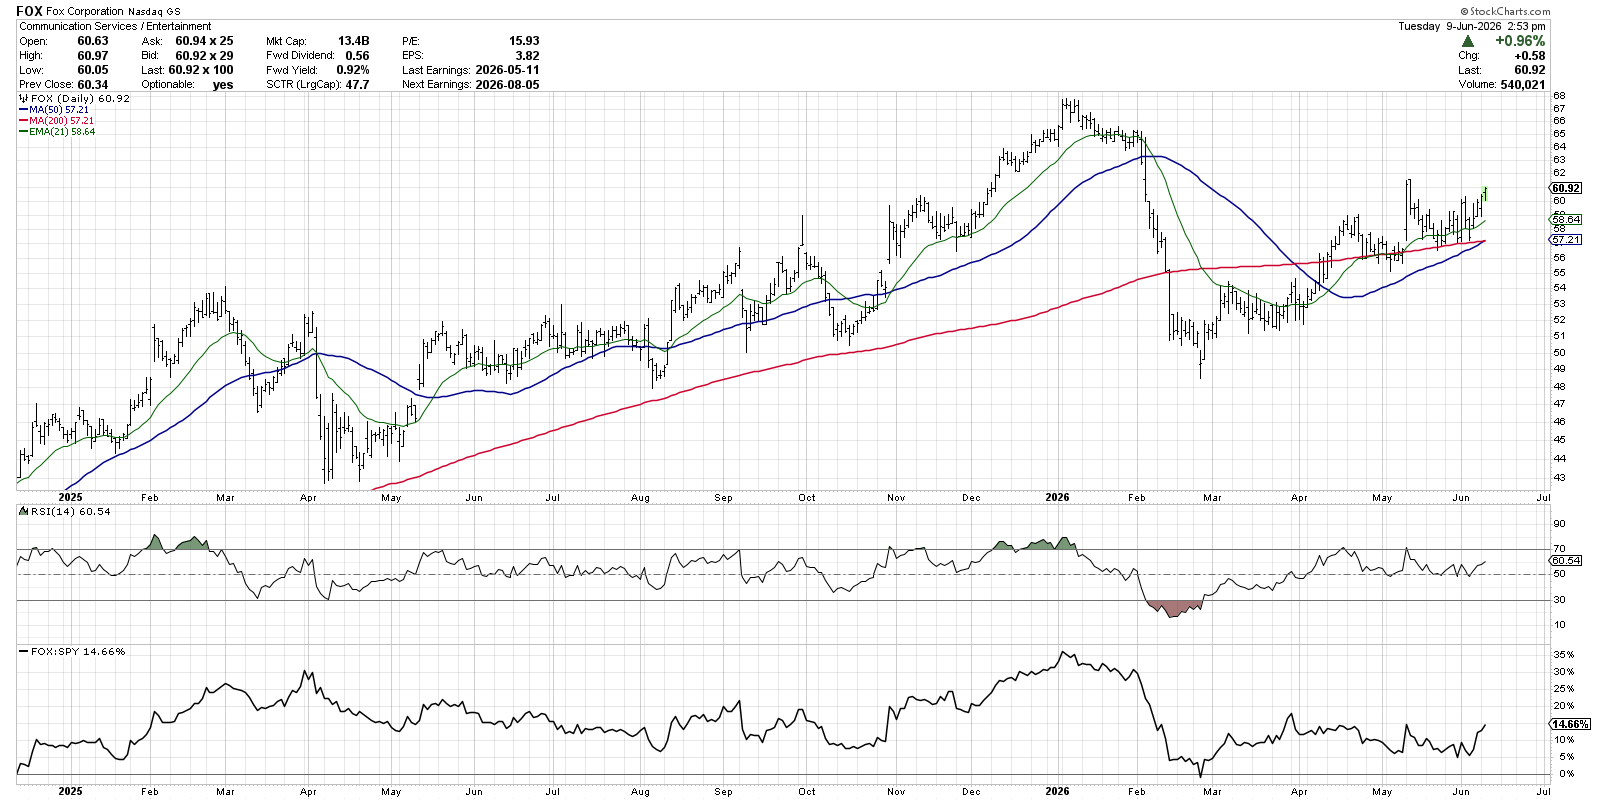
Fox Corporation (FOX), recently featured as one of our Top Ten Charts to Watch for June, currently shows a SCTR score around 49, mainly because it’s still recovering from a significant selloff in Q1. Over the last three months, however, the stock has established a clear pattern of higher highs and higher lows. In April, FOX broke back above the 200-day moving average and, over the last six weeks, we’ve seen several bounces off this moving average support.
On a chart like this one, I want to watch for the higher highs/higher lows pattern to continue, which means pullbacks need to always establish a new higher low. I also want to ensure that the RSI remains above the 40-50 range to make sure the momentum remains strong on this chart.
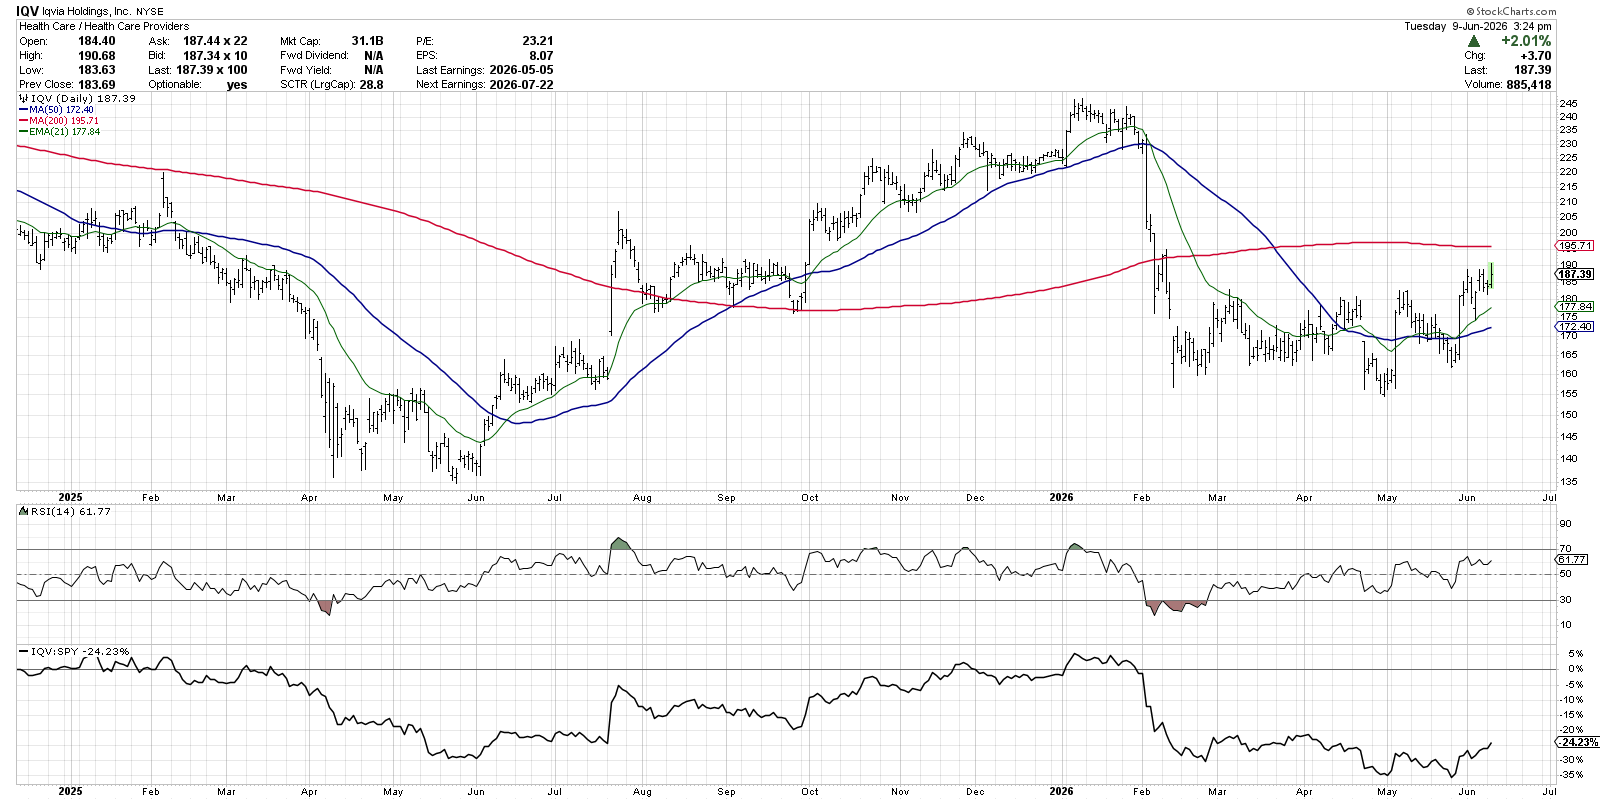
The only Health Care name appearing on the scan earlier today was Iqvia Holdings (IQV) in the health care providers group. While similar to the chart of FOX with a pattern of higher highs and higher lows, IQV differs in that it still remains below the 200-day moving average.
For this chart, I find that the initial breakout above resistance around $180 provides an early warning of a new accumulation phase. That’s when the stock first appeared on my new three-month highs scan. If the price can rise further and break above the 200-day moving average while the RSI pushes above the 60 level, then this could be an emerging leader just getting started in a longer-term uptrend phase.
With investors becoming more skeptical of overextended technology names and looking for opportunities to diversify outside of growth sectors, scans like this one can help to uncover hidden gems in value and defensive sectors.
I sign off every episode of my daily market recap show with the tagline, “It’s always a good time to own good charts.” By running regular scans for stocks showing strong price action after a period of weaker momentum, perhaps we can uncover those next “good charts” before they become too extended!
By the way, this article came from a viewer question during our Friday mailbag episode of CHART THIS with Dave Keller. Head over to my YouTube channel to check out more great Q&A from like-minded investors!
RR#6,
Dave
P.S. Ready to upgrade your investment process? Check out my free behavioral investing course!
David Keller, CMT
President and Chief Strategist
Sierra Alpha Research LLC
marketmisbehavior.com
https://www.youtube.com/c/MarketMisbehavior
Disclaimer: This blog is for educational purposes only and should not be construed as financial advice. The ideas and strategies should never be used without first assessing your own personal and financial situation, or without consulting a financial professional.
The author does not have a position in mentioned securities at the time of publication. Any opinions expressed herein are solely those of the author and do not in any way represent the views or opinions of any other person or entity.