The Summer of Small-Cap Value? This Market Corner is Heating Up

Key Takeaways
- As SpaceX mania builds, the lower-left section of the style box is near the top of the YTD factor pack.
- Small-cap value is flirting with record highs this week as mega-cap tech and AI stocks stumble.
- Intermarket analysis, macro implications, and risk appetite are going hand in hand with small-cap value price action.
Investors are bracing for Friday’s SpaceX (SPCX) IPO. The Nasdaq 100 Volatility Index ($VXN) lifted off into the mid-30s this week as money reshuffled across sectors and themes. Whether funds and large investors are making room for what will likely be the biggest IPO on record remains unclear, but rotation is happening across global markets.
Health Care, Industrials, REITs, and consumer stocks were beneficiaries on Monday and Tuesday, along with transports, which continued to chug along to new all-time highs. But it’s not just a sector story. Styles are getting a makeover as the semiconductor-led rally loses some of its shine. Amid this week’s wild price action, U.S. small-cap value notched a fresh high.
Alpha Awakens Far Away from Large-Cap Growth
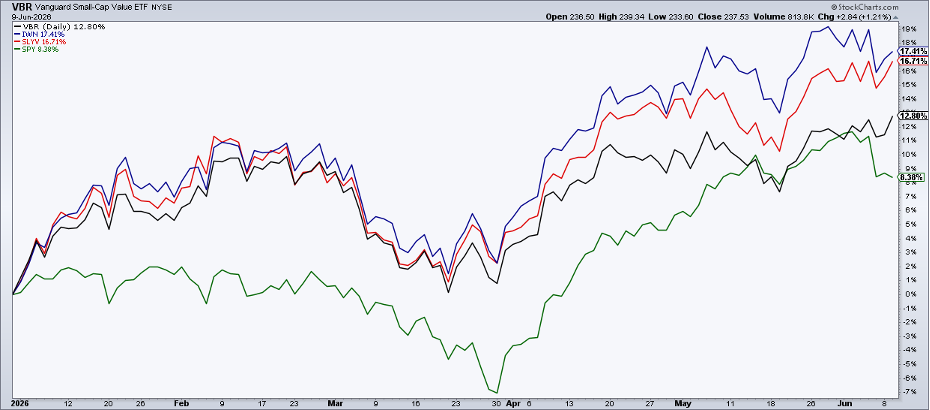
Indeed, the lower-left corner of the style box looks good these days. While it’s a relatively small percentage of the domestic equity arena, there are several low-cost and liquid ETFs to play it. I own the Vanguard Small-Cap Value ETF (VBR), but other fine options include the iShares Russell 2000 Value ETF (IWN) and the State Street SPDR S&P 600 Small-Cap Value ETF (SLYV).
IWN, which houses a sizable number of unprofitable companies, lags. Even with bounces on Monday and Tuesday, it was a percentage point below its 2026 high close. The iShares fund ended Tuesday pennies from a record, while VBR was in uncharted territory. Pick any of the three and you’ll have a YTD winner on your hands, at least relative to the S&P 500’s relatively paltry 8.4% total return.
But let’s focus on SLYV. It’s higher quality than IWN while offering more focused ownership than VBR.
Lousy Factor Performance from 2016–2025
Investors of my ilk (those who studied finance beginning in the mid-2000s) were surely persuaded by the Fama-French model, including the size and value factors’ long-term outperformance trends. Hence, going overweight in U.S. small-cap value made sense from diversification and long-term return perspectives.
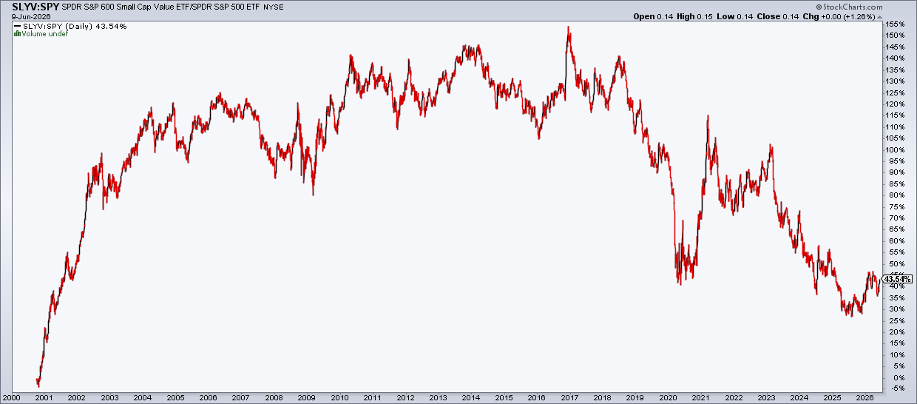
Of course, right when the textbooks caught on in earnest, alpha went elsewhere. From 2016 through the middle of last year, SLYV:SPY struggled mightily. The current relative bounce has the look of a mere corrective phase in the longer-term downtrend.
Small-Cap Value Technical Trends Turn Intriguing
That doesn’t mean the next few months can’t be the summer of small-cap value. In fact, if you were to pull up a SharpChart of SLYV, you’d see some constructive moves.
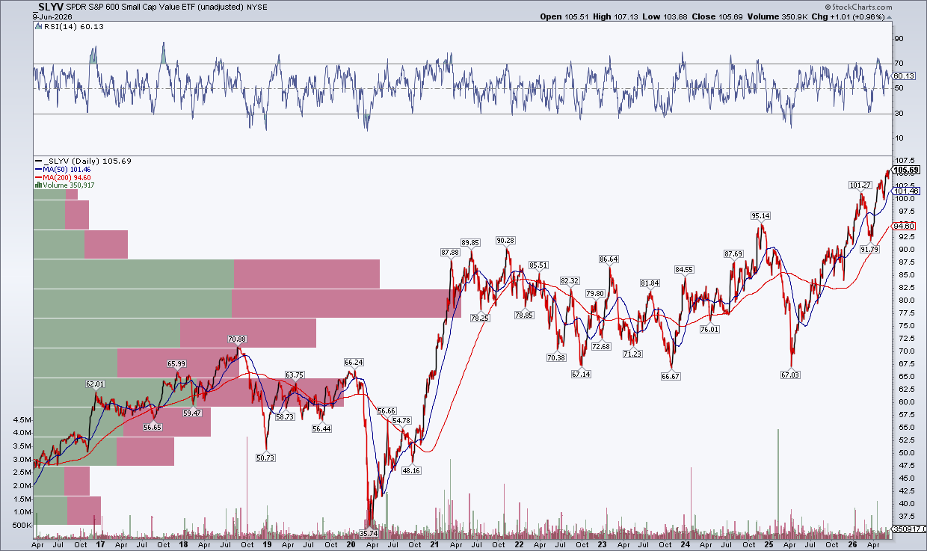
Zooming out 10 years, there’s reason for optimism. Notice in the chart below that SLYV only recently rallied through its November 2024 peak near $95. This year’s double-digit gain also broke a years-long consolidation (arguably a small cyclical bear market) from early 2021 through 2025.
Today, with a rising long-term 200-day moving average and a series of higher highs and higher lows off the April 2025 bottom, the bulls control the primary trend. SLYV held key support in the upper $60s on a few occasions, helping the ETF establish a base. We can even project a rough measured-move upside price objective to $120–$125 based on the depth of the November 2024 to April 2025 decline and the subsequent breakout.
Rotation Nation
Earlier this week, I outlined three go-to indicators for daily market checks. Well, let’s add No. 4.
I want you to check out StockCharts’ Market Summary page. The Market Factors section houses the standard Morningstar Style Box. You can view it traditionally with nine boxes or click on “Extended” to capture more market insight in data form.
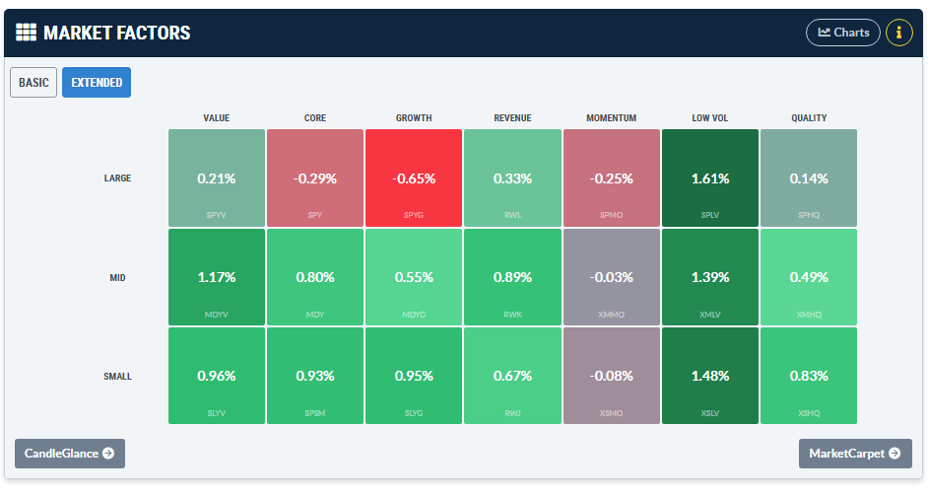
Interestingly, on Tuesday’s sharp tech selloff, small-cap value was up 1%. Low-vol jumps out, too, up 1.5%. Rotation has been the market’s password of late.
Broadening Is More Frustrating Than You Think
CNBC’s Michael Santoli often cautions investors to be careful what they wish for regarding “broadening” trades. It’s rarely an elegant handoff from growth to value (and large-cap to SMID-cap); look no further than the shaky stretch from late October through February. But when tech takes a breather and other industries step out onto the court, opportunities arise.
Hopes Pinned to Regional Banks? Really?
For SLYV specifically, regional banks, small-ish retailers, and more speculative tech are key. Biotech is a larger driver for the less-profitable Russell 2000 Value Index.
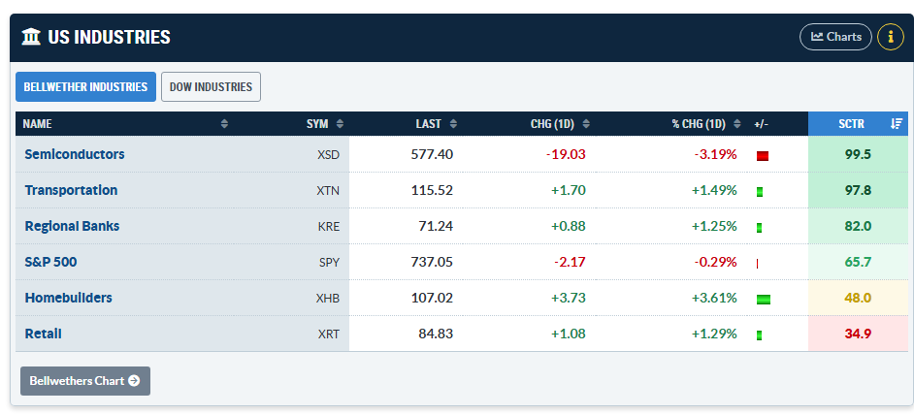
Double-clicking on that first crucial industry, the State Street SPDR S&P Regional Banking ETF (KRE) settled at its highest level since February 20 on Tuesday. Up four sessions running coming into midweek, this bellwether industry has been on the mend and now sports a SCTR score of 82.0. KRE still has wood to chop, with the YTD high a few percentage points above today’s price, while its $79 record high was notched more than four years ago. Despite some recent outperformance, KRE remains a show-me story.
Retail Stocks Also Perking Up, But Is It a Blip?
It’s the same story for those smallish retail stocks. I’ve delved into the State Street SPDR S&P Retail ETF (XRT) before, and it, too, is a guilty-until-proven-innocent chart right now.
The Bottom Line
If we see more days like Tuesday, with small-cap value leading, it could point to better macro conditions over the next few months: easing interest rates, improved economic growth, and increased discretionary spending among middle-income consumers, for instance. So, while SLYV is not a table-pounding buy at the moment, its action is becoming increasingly important amid the market rotation.
Disclaimer: This blog is for educational purposes only and should not be construed as financial advice. The ideas and strategies should never be used without first assessing your own personal and financial situation, or without consulting a financial professional.