Banks are STRUGGLING. These 4 Financial Charts Look BETTER.
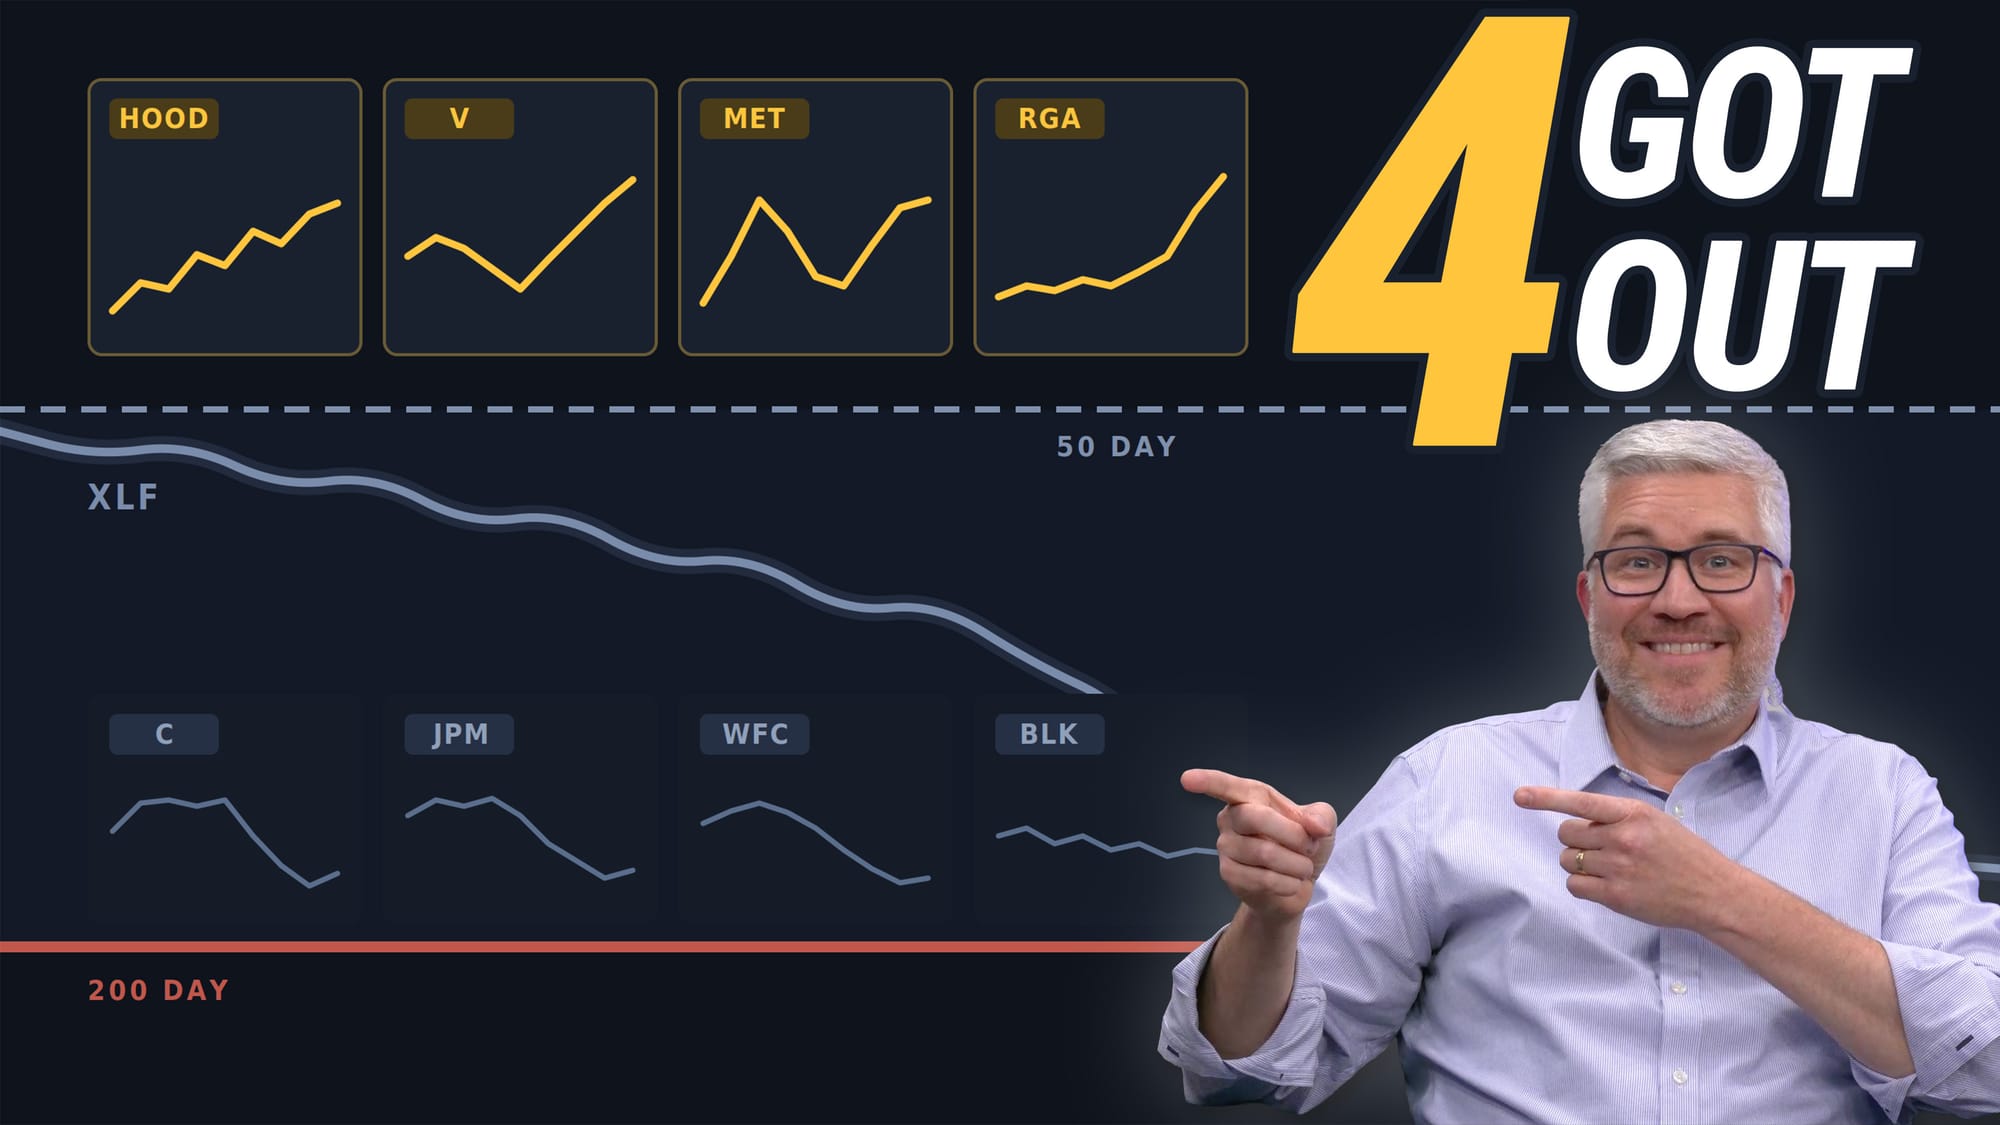
Q3 earnings season kicks off with the financial sector, but many major banks are entering this critical period in questionable technical shape. Dave Keller examines the XLF along with key financial stocks including Citigroup (C), BlackRock (BLK), and Berkshire Hathaway (BRK/B), highlighting why the 200-day moving average could be the most important level to watch as earnings results begin rolling in.
From there, Dave uses the StockCharts Screener and SCTR rankings to identify four financial stocks with more constructive technical setups: Robinhood (HOOD), Visa (V), MetLife (MET), and Reinsurance Group of America (RGA). Along the way, he demonstrates how moving averages, RSI, relative strength, and price alerts can help investors distinguish between stocks testing support and those already showing signs of renewed accumulation.
This video was originally published on October 13, 2026.
Previously recorded videos from Dave are available at this link.